Wells Fargo 2010 Annual Report Download - page 85
Download and view the complete annual report
Please find page 85 of the 2010 Wells Fargo annual report below. You can navigate through the pages in the report by either clicking on the pages listed below, or by using the keyword search tool below to find specific information within the annual report.-
 1
1 -
2
-
3
-
4
-
5
-
6
-
7
-
8
-
9
-
10
-
11
-
12
-
13
-
14
-
15
-
16
-
17
-
18
-
19
-
20
-
21
-
22
-
23
-
24
-
25
-
26
-
27
-
28
-
29
-
30
-
31
-
32
-
33
-
34
-
35
-
36
-
37
-
38
-
39
-
40
-
41
-
42
-
43
-
44
-
45
-
46
-
47
-
48
-
49
-
50
-
51
-
52
-
53
-
54
-
55
-
56
-
57
-
58
-
59
-
60
-
61
-
62
-
63
-
64
-
65
-
66
-
67
-
68
-
69
-
70
-
71
-
72
-
73
-
74
-
 75
75 -
 76
76 -
 77
77 -
 78
78 -
 79
79 -
 80
80 -
 81
81 -
 82
82 -
 83
83 -
 84
84 -
 85
85 -
 86
86 -
 87
87 -
 88
88 -
 89
89 -
 90
90 -
 91
91 -
 92
92 -
 93
93 -
 94
94 -
 95
95 -
96
-
97
-
98
-
99
-
100
-
101
-
102
-
103
-
104
-
105
-
106
-
107
-
108
-
109
-
110
-
111
-
112
-
113
-
114
-
115
-
116
-
117
-
118
-
119
-
120
-
121
-
122
-
123
-
124
-
125
-
126
-
127
-
128
-
129
-
130
-
131
-
132
-
133
-
134
-
135
-
136
-
137
-
138
-
139
-
140
-
141
-
142
-
143
-
144
-
145
-
146
-
147
-
148
-
149
-
150
-
151
-
152
-
153
-
154
-
155
-
156
-
157
-
158
-
159
-
160
-
161
-
162
-
163
-
164
-
165
-
166
-
167
-
168
-
169
-
170
-
171
-
172
-
173
-
174
-
175
-
176
-
177
-
178
-
179
-
180
-
181
-
182
-
183
-
184
-
185
-
186
-
187
-
188
-
189
-
190
-
191
-
192
-
193
-
194
-
195
-
196
-
197
-
198
-
199
-
200
-
201
-
202
-
203
-
204
-
205
-
206
-
207
-
208
-
209
-
210
-
211
-
212
-
213
-
214
-
215
-
216
-
217
-
218
-
219
-
220
-
221
-
222
-
223
-
224
-
225
-
226
-
227
-
228
-
229
-
230
-
231
-
232
 |
 |
the crisis including excessive leverage, inadequate and low
quality capital and insufficient liquidity buffers. The U.S.
regulatory bodies are reviewing the final international standards
and final U.S. rulemaking is expected to be completed in 2011.
Although uncertainty exists regarding the final rules, we are
evaluating the impact of Basel III on our capital ratios based on
our interpretation of the proposed capital requirements and
expect to be above a 7% Tier 1 common equity ratio under
Basel III within the next few quarters.
We are well underway toward Basel II and Basel III
implementation and are currently on schedule to enter the
parallel run phase of Basel II in 2012 with regulatory approval.
Our delayed entry into the parallel run phase was approved by
the FRB in 2010 as a result of the acquisition of Wachovia.
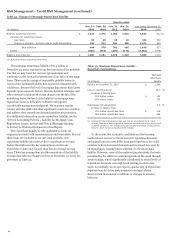
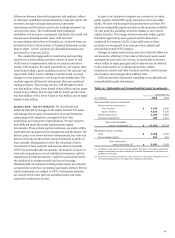
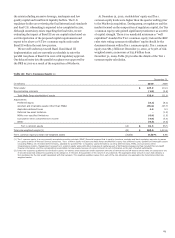
At December 31, 2010, stockholders’ equity and Tier 1
common equity levels were higher than the quarter ending prior
to the Wachovia acquisition. During 2009, as regulators and the
market focused on the composition of regulatory capital, the Tier
1 common equity ratio gained significant prominence as a metric
of capital strength. There is no mandated minimum or “well
capitalized” standard for Tier 1 common equity; instead the RBC
rules state voting common stockholders’ equity should be the
dominant element within Tier 1 common equity. Tier 1 common
equity was $81.3 billion at December 31, 2010, or 8.30% of risk-
weighted assets, an increase of $15.8 billion from
December 31, 2009. Table 38 provides the details of the Tier 1
common equity calculation.
Table 38: Tier 1 Common Equity (1)
December 31,
(in billions)
2010
2009
Total equity $
127.9
114.4
Noncontrolling interests
(1.5)
(2.6)
Total Wells Fargo stockholders' equity
126.4
111.8
Adjustments:
Preferred equity
(8.1)
(8.1)
Goodwill and intangible assets (other than MSRs)
(35.5)
(37.7)
Applicable deferred taxes
4.3
5.3
Deferred tax asset limitation
-
(1.0)
MSRs over specified limitations
(0.9)
(1.6)
Cumulative other comprehensive income
(4.6)
(3.0)
Other
(0.3)
(0.2)
Tier 1 common equity (A) $
81.3
65.5
Total risk-weighted assets (2) (B) $
980.0
1,013.6
Tier 1 common equity to total risk-weighted assets (A)/(B)
8.30
%
6.46
(1)
Tier 1 common equity is a non-generally accepted accounting principle (GAAP) financial measure that is used by investors, analysts and bank regulatory agencies to assess
the capital position of financial services companies. Tier 1 common equity includes total Wells Fargo stockholders
' equity, less preferred equity, goodwill and intangible assets
(excluding MSRs), net of related deferred taxes, adjusted for specified Tier 1 regulatory capital limitations covering deferred taxes, MSRs, and cumulative other
comprehensive income. Management reviews Tier 1 common equity along with other measures of capital as part of its financial analyses and has included this non-GAAP
financial information, and the corresponding reconciliation to total equity, because of current interest in such information on the part of market participants.
(2) Under the regulatory guidelines for risk-based capital, on-balance sheet assets and credit equivalent amounts of derivatives and off-balance sheet items are assigned to one
of several broad risk categories according to the obligor or, if relevant, the guarantor or the nature of any collateral. The aggregate dollar amount in each risk category is
then multiplied by the risk weight associated with that category. The resulting weighted values from each of the risk categories are aggregated for determining total risk-
weighted assets.
83