Wells Fargo 2010 Annual Report Download - page 82
Download and view the complete annual report
Please find page 82 of the 2010 Wells Fargo annual report below. You can navigate through the pages in the report by either clicking on the pages listed below, or by using the keyword search tool below to find specific information within the annual report.-
 1
1 -
2
-
3
-
4
-
5
-
6
-
7
-
8
-
9
-
10
-
11
-
12
-
13
-
14
-
15
-
16
-
17
-
18
-
19
-
20
-
21
-
22
-
23
-
24
-
25
-
26
-
27
-
28
-
29
-
30
-
31
-
32
-
33
-
34
-
35
-
36
-
37
-
38
-
39
-
40
-
41
-
42
-
43
-
44
-
45
-
46
-
47
-
48
-
49
-
50
-
51
-
52
-
53
-
54
-
55
-
56
-
57
-
58
-
59
-
60
-
61
-
62
-
63
-
64
-
65
-
66
-
67
-
68
-
69
-
70
-
71
-
 72
72 -
 73
73 -
 74
74 -
 75
75 -
 76
76 -
 77
77 -
 78
78 -
 79
79 -
 80
80 -
 81
81 -
 82
82 -
 83
83 -
 84
84 -
 85
85 -
 86
86 -
 87
87 -
 88
88 -
 89
89 -
 90
90 -
 91
91 -
 92
92 -
93
-
94
-
95
-
96
-
97
-
98
-
99
-
100
-
101
-
102
-
103
-
104
-
105
-
106
-
107
-
108
-
109
-
110
-
111
-
112
-
113
-
114
-
115
-
116
-
117
-
118
-
119
-
120
-
121
-
122
-
123
-
124
-
125
-
126
-
127
-
128
-
129
-
130
-
131
-
132
-
133
-
134
-
135
-
136
-
137
-
138
-
139
-
140
-
141
-
142
-
143
-
144
-
145
-
146
-
147
-
148
-
149
-
150
-
151
-
152
-
153
-
154
-
155
-
156
-
157
-
158
-
159
-
160
-
161
-
162
-
163
-
164
-
165
-
166
-
167
-
168
-
169
-
170
-
171
-
172
-
173
-
174
-
175
-
176
-
177
-
178
-
179
-
180
-
181
-
182
-
183
-
184
-
185
-
186
-
187
-
188
-
189
-
190
-
191
-
192
-
193
-
194
-
195
-
196
-
197
-
198
-
199
-
200
-
201
-
202
-
203
-
204
-
205
-
206
-
207
-
208
-
209
-
210
-
211
-
212
-
213
-
214
-
215
-
216
-
217
-
218
-
219
-
220
-
221
-
222
-
223
-
224
-
225
-
226
-
227
-
228
-
229
-
230
-
231
-
232
 |
 |
Risk Management –Asset/Liability Management (continued)
LIQUIDITY AND FUNDING The objective of effective liquidity
management is to ensure that we can meet customer loan
requests, customer deposit maturities/withdrawals and other
cash commitments efficiently under both normal operating
conditions and under unpredictable circumstances of industry or
market stress. To achieve this objective, the Corporate ALCO
establishes and monitors liquidity guidelines that require
sufficient asset-based liquidity to cover potential funding
requirements and to avoid over-dependence on volatile, less
reliable funding markets. We set these guidelines for both the
consolidated balance sheet and for the Parent to ensure that the
Parent is a source of strength for its regulated, deposit-taking
banking subsidiaries.
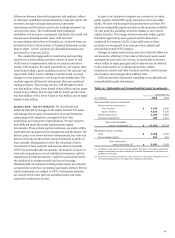
Unencumbered debt and equity securities in the securities
available-for-sale portfolio provide asset liquidity, in addition to
the immediately liquid resources of cash and due from banks
and federal funds sold, securities purchased under resale
agreements and other short-term investments. The weighted-
average expected remaining maturity of the debt securities
within this portfolio was 6.1 years at December 31, 2010. Of the
$160.1 billion (cost basis) of debt securities in this portfolio at
December 31, 2010, $32.6 billion (20%) is expected to mature or
be prepaid in 2011 and an additional $20.4 billion (13%) in 2012.
Asset liquidity is further enhanced by our ability to sell or
securitize loans in secondary markets and to pledge loans to
access secured borrowing facilities through the Federal Home
Loan Banks (FHLB) and the FRB. In 2010, we sold mortgage
loans of $363 billion. The amount of mortgage loans and other
consumer loans available to be sold, securitized or pledged was
approximately $236 billion at December 31, 2010.
Core customer deposits have historically provided a sizeable
source of relatively stable and low-cost funds. Average core
deposits funded 62.9% and 60.4% of average total assets in 2010
and 2009, respectively.
Additional funding is provided by long-term debt (including
trust preferred securities), other foreign deposits, and short-
term borrowings. Long-term debt averaged $185.4 billion in
2010 and $231.8 billion in 2009. Short-term borrowings
averaged $46.8 billion in 2010 and $52.0 billion in 2009.
We anticipate making capital expenditures of approximately
$1.5 billion in 2011 for our stores, relocation and remodeling of
our facilities, and routine replacement of furniture, equipment
and servers. We fund expenditures from various sources,
including retained earnings and borrowings.
Liquidity is also available through our ability to raise funds in
a variety of domestic and international money and capital
markets. We access capital markets for long-term funding
through issuances of registered debt securities, private
placements and asset-backed secured funding. Investors in the
long-term capital markets generally will consider, among other
factors, a company’s debt rating in making investment decisions.
Rating agencies base their ratings on many quantitative and
qualitative factors, including capital adequacy, liquidity, asset
quality, business mix, the level and quality of earnings, and
rating agency assumptions regarding the probability and extent
of Federal financial assistance or support for certain large
financial institutions. Adverse changes in these factors could
result in a reduction of our credit rating; however, a reduction in
credit rating would not cause us to violate any of our debt
covenants. See the “Risk Factors” section of this Report for
additional information regarding recent legislative developments
and our credit ratings.
We continue to evaluate the potential impact on liquidity
management of regulatory proposals, including Basel III and
those required under the Dodd-Frank Act, as they move closer to
the final rule-making process.
Parent Under SEC rules, the Parent is classified as a “well-
known seasoned issuer,” which allows it to file a registration
statement that does not have a limit on issuance capacity. “Well-
known seasoned issuers” generally include those companies with
a public float of common equity of at least $700 million or those
companies that have issued at least $1 billion in aggregate
principal amount of non-convertible securities, other than
common equity, in the last three years. In June 2009, the
Parent filed a registration statement with the SEC for the
issuance of senior and subordinated notes, preferred stock and
other securities. The Parent’s ability to issue debt and other
securities under this registration statement is limited by the debt
issuance authority granted by the Board. The Parent is currently
authorized by the Board to issue $60 billion in outstanding
short-term debt and $170 billion in outstanding long-term debt.
During 2010, the Parent issued $1.3 billion in non-guaranteed
registered senior notes. In February 2011, the Parent remarketed
$2.5 billion of junior subordinated notes in connection with
Wachovia’s 2006 issuance of 5.80% Fixed-to-floating rate
Wachovia Income Trust hybrid securities. The junior
subordinated notes were exchanged with Wells Fargo for newly
issued senior notes.
The proceeds from securities issued in 2010 were used for
general corporate purposes, and we expect that the proceeds
from securities issued in the future will also be used for the same
purposes. The Parent also issues commercial paper from time to
time, subject to its short-term debt limit.
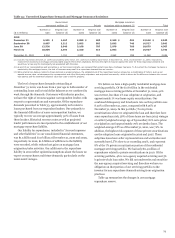
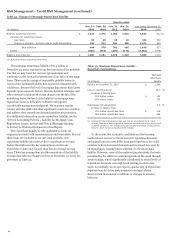
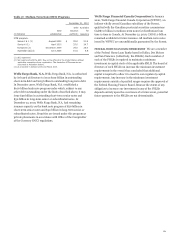
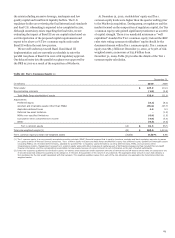
Table 37 provides information regarding the Parent’s
medium-term note (MTN) programs. The Parent may issue
senior and subordinated debt securities under Series I & J, and
the European and Australian programmes. Under Series K, the
Parent may issue senior debt securities linked to one or more
indices.
80