Wells Fargo 2010 Annual Report Download - page 209
Download and view the complete annual report
Please find page 209 of the 2010 Wells Fargo annual report below. You can navigate through the pages in the report by either clicking on the pages listed below, or by using the keyword search tool below to find specific information within the annual report.-
 1
1 -
2
-
3
-
4
-
5
-
6
-
7
-
8
-
9
-
10
-
11
-
12
-
13
-
14
-
15
-
16
-
17
-
18
-
19
-
20
-
21
-
22
-
23
-
24
-
25
-
26
-
27
-
28
-
29
-
30
-
31
-
32
-
33
-
34
-
35
-
36
-
37
-
38
-
39
-
40
-
41
-
42
-
43
-
44
-
45
-
46
-
47
-
48
-
49
-
50
-
51
-
52
-
53
-
54
-
55
-
56
-
57
-
58
-
59
-
60
-
61
-
62
-
63
-
64
-
65
-
66
-
67
-
68
-
69
-
70
-
71
-
72
-
73
-
74
-
75
-
76
-
77
-
78
-
79
-
80
-
81
-
82
-
83
-
84
-
85
-
86
-
87
-
88
-
89
-
90
-
91
-
92
-
93
-
94
-
95
-
96
-
97
-
98
-
99
-
100
-
101
-
102
-
103
-
104
-
105
-
106
-
107
-
108
-
109
-
110
-
111
-
112
-
113
-
114
-
115
-
116
-
117
-
118
-
119
-
120
-
121
-
122
-
123
-
124
-
125
-
126
-
127
-
128
-
129
-
130
-
131
-
132
-
133
-
134
-
135
-
136
-
137
-
138
-
139
-
140
-
141
-
142
-
143
-
144
-
145
-
146
-
147
-
148
-
149
-
150
-
151
-
152
-
153
-
154
-
155
-
156
-
157
-
158
-
159
-
160
-
161
-
162
-
163
-
164
-
165
-
166
-
167
-
168
-
169
-
170
-
171
-
172
-
173
-
174
-
175
-
176
-
177
-
178
-
179
-
180
-
181
-
182
-
183
-
184
-
185
-
186
-
187
-
188
-
189
-
190
-
191
-
192
-
193
-
194
-
195
-
196
-
197
-
198
-
 199
199 -
 200
200 -
 201
201 -
 202
202 -
 203
203 -
 204
204 -
 205
205 -
 206
206 -
 207
207 -
 208
208 -
 209
209 -
 210
210 -
 211
211 -
 212
212 -
 213
213 -
 214
214 -
 215
215 -
 216
216 -
 217
217 -
 218
218 -
 219
219 -
220
-
221
-
222
-
223
-
224
-
225
-
226
-
227
-
228
-
229
-
230
-
231
-
232
 |
 |

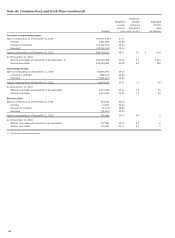
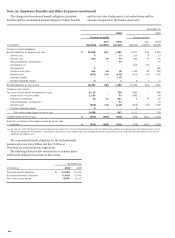
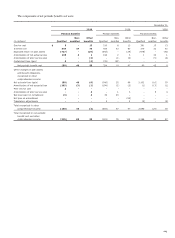
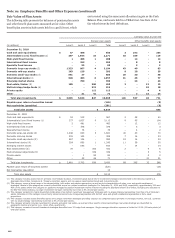
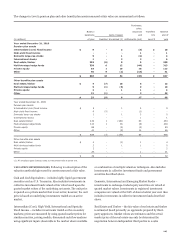
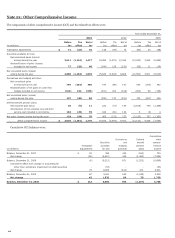
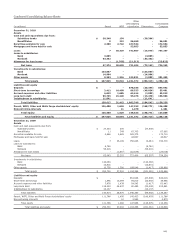
The changes in Level 3 pension plan and other benefit plan assets measured at fair value are summarized as follows:
Purchases,
sales,
Balance
issuances
Transfers
Balance
beginning
Gains (losses)
and
into
end of
(in millions)
of year
Realized
Unrealized (1)
settlements (net)
Level 3
year
Year ended December 31, 2010
Pension plan assets
Intermediate (core) fixed income $ 9
-
2
(3)
2
10
High-yield fixed income
-
-
-
1
-
1
Domestic large-cap stocks
5
-
1
(2)
-
4
International stocks
1
-
2
3
-
6
Real estate/timber
353
(6)
8
5
-
360
Multi-strategy hedge funds
339
6
12
(44)
-
313
Private equity
83
1
10
18
-
112
Other
46
9
(1)
(13)
-
41
$ 836
10
34
(35)
2
847
Other benefits plan assets
Real estate/timber $ 4
(7)
10
5
-
12
Multi-strategy hedge funds 5
(1)
(3)
9
-
10
Private equity 2
-
1
1
-
4
Other 21
(1)
-
2
-
22
$ 32
(9)
8
17
-
48
Year ended December 31, 2009
Pension plan assets
Intermediate (core) fixed income $ 5
-
1
3
-
9
High-yield fixed income
6
(5)
-
(1)
-
-
Domestic large-cap stocks
1
-
1
3
-
5
International stocks
-
-
-
1
-
1
Real estate/timber
433
1
(161)
80
-
353
Multi-strategy hedge funds
310
1
36
(8)
-
339
Private equity
88
-
(2)
(3)
-
83
Other
41
-
(5)
10
-
46
$ 884
(3)
(130)
85
-
836
Other benefits plan assets
Real estate/timber $ 4
-
(1)
1
-
4
Multi-strategy hedge funds 3
-
1
1
-
5
Private equity 2
-
-
-
-
2
Other 20
-
-
1
-
21
$ 29
-
-
3
-
32
(1) All unrealized gains (losses) relate to instruments held at period end.
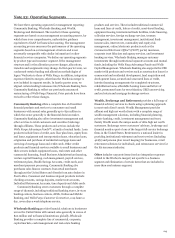
VALUATION METHODOLOGIES Following is a description of the
valuation methodologies used for assets measured at fair value.
Cash and Cash Equivalents – includes highly liquid government
securities such as U.S. Treasuries. Also includes investments in
collective investment funds valued at fair value based upon the
quoted market values of the underlying net assets. The unit price
is quoted on a private market that is not active; however, the unit
price is based on underlying investments traded on an active
market.
Intermediate (Core), High-Yield, International and Specialty
Fixed Income – includes investments traded on the secondary
markets; prices are measured by using quoted market prices for
similar securities, pricing models, discounted cash flow analyses
using significant inputs observable in the market where available
or combination of multiple valuation techniques. Also includes
investments in collective investment funds and government
securities described above.
Domestic, International and Emerging Market Stocks –
investments in exchange-traded equity securities are valued at
quoted market values. Investments in registered investment
companies are valued at the NAV of shares held at year end. Also
includes investments in collective investment funds described
above.
Real Estate and Timber – the fair value of real estate and timber
is estimated based primarily on appraisals prepared by third-
party appraisers. Market values are estimates and the actual
market price of the real estate can only be determined by
negotiation between independent third parties in a sales
207