Wells Fargo 2010 Annual Report Download - page 65
Download and view the complete annual report
Please find page 65 of the 2010 Wells Fargo annual report below. You can navigate through the pages in the report by either clicking on the pages listed below, or by using the keyword search tool below to find specific information within the annual report.-
 1
1 -
2
-
3
-
4
-
5
-
6
-
7
-
8
-
9
-
10
-
11
-
12
-
13
-
14
-
15
-
16
-
17
-
18
-
19
-
20
-
21
-
22
-
23
-
24
-
25
-
26
-
27
-
28
-
29
-
30
-
31
-
32
-
33
-
34
-
35
-
36
-
37
-
38
-
39
-
40
-
41
-
42
-
43
-
44
-
45
-
46
-
47
-
48
-
49
-
50
-
51
-
52
-
53
-
54
-
 55
55 -
 56
56 -
 57
57 -
 58
58 -
 59
59 -
 60
60 -
 61
61 -
 62
62 -
 63
63 -
 64
64 -
 65
65 -
 66
66 -
 67
67 -
 68
68 -
 69
69 -
 70
70 -
 71
71 -
 72
72 -
 73
73 -
 74
74 -
 75
75 -
76
-
77
-
78
-
79
-
80
-
81
-
82
-
83
-
84
-
85
-
86
-
87
-
88
-
89
-
90
-
91
-
92
-
93
-
94
-
95
-
96
-
97
-
98
-
99
-
100
-
101
-
102
-
103
-
104
-
105
-
106
-
107
-
108
-
109
-
110
-
111
-
112
-
113
-
114
-
115
-
116
-
117
-
118
-
119
-
120
-
121
-
122
-
123
-
124
-
125
-
126
-
127
-
128
-
129
-
130
-
131
-
132
-
133
-
134
-
135
-
136
-
137
-
138
-
139
-
140
-
141
-
142
-
143
-
144
-
145
-
146
-
147
-
148
-
149
-
150
-
151
-
152
-
153
-
154
-
155
-
156
-
157
-
158
-
159
-
160
-
161
-
162
-
163
-
164
-
165
-
166
-
167
-
168
-
169
-
170
-
171
-
172
-
173
-
174
-
175
-
176
-
177
-
178
-
179
-
180
-
181
-
182
-
183
-
184
-
185
-
186
-
187
-
188
-
189
-
190
-
191
-
192
-
193
-
194
-
195
-
196
-
197
-
198
-
199
-
200
-
201
-
202
-
203
-
204
-
205
-
206
-
207
-
208
-
209
-
210
-
211
-
212
-
213
-
214
-
215
-
216
-
217
-
218
-
219
-
220
-
221
-
222
-
223
-
224
-
225
-
226
-
227
-
228
-
229
-
230
-
231
-
232
 |
 |

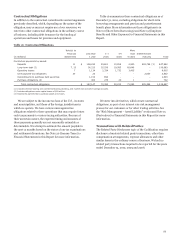
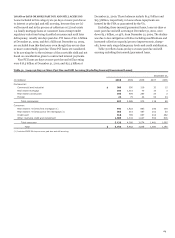
Most of the modifications result in material payment reduction
to the customer. Because of the write-down of the PCI loans in
purchase accounting, our post-merger modifications to PCI Pick-
a-Pay loans have not resulted in any modification-related
provision for credit losses. To the extent we modify loans not in
the PCI Pick-a-Pay portfolio, we may establish an allowance for
consumer loans modified in a TDR.
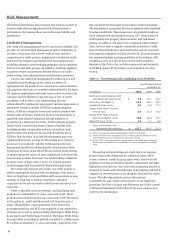
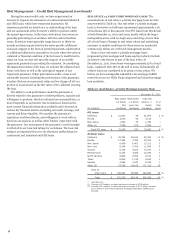
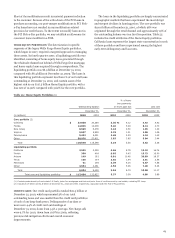
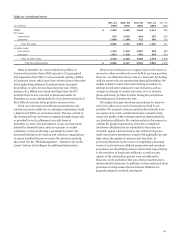
HOME EQUITY PORTFOLIOS The deterioration in specific
segments of the legacy Wells Fargo Home Equity portfolios,
which began in 2007, required a targeted approach to managing
these assets. In fourth quarter 2007, a liquidating portfolio was
identified, consisting of home equity loans generated through
the wholesale channel not behind a Wells Fargo first mortgage,
and home equity loans acquired through correspondents. The
liquidating portfolio was $6.9 billion at December 31, 2010,
compared with $8.4 billion at December 31, 2009. The loans in
this liquidating portfolio represent less than 1% of our total loans
outstanding at December 31, 2010, and contain some of the
highest risk in our $117.5 billion Home Equity portfolio, with a
loss rate of 10.90% compared with 3.62% for the core portfolio.
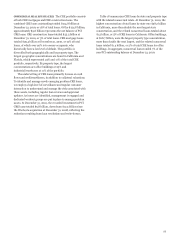
The loans in the liquidating portfolio are largely concentrated
in geographic markets that have experienced the most abrupt
and steepest declines in housing prices. The core portfolio was
$110.6 billion at December 31, 2010, of which 98% was
originated through the retail channel and approximately 19% of
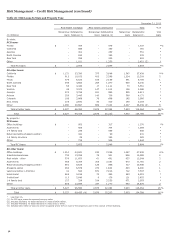
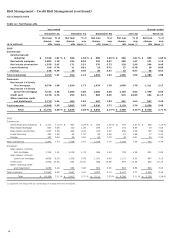
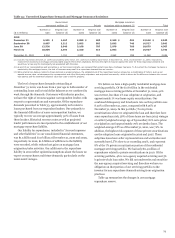
the outstanding balance was in a first lien position. Table 25
includes the credit attributes of the Home Equity portfolios.
California loans represent the largest state concentration in each
of these portfolios and have experienced among the highest
early-term delinquency and loss rates.
Table 25: Home Equity Portfolios (1)
% of loans
two payments
Outstanding balance
or more past due
Loss rate
December 31,
December 31,
December 31,
(in millions)
2010
2009
2010
2009
2010
2009
Core portfolio (2)
California $
27,850
30,264
3.30
%
4.12
4.92
5.42
Florida
12,036
12,038
5.46
5.48
6.13
4.73
New Jersey
8,629
8,379
3.44
2.50
1.95
1.30
Virginia
5,667
5,855
2.33
1.91
1.86
1.06
Pennsylvania
5,432
5,051
2.48
2.03
1.24
1.49
Other
50,976
53,811
2.83
2.85
3.04
2.44
Total
110,590
115,398
3.24
3.35
3.62
3.28
Liquidating portfolio
California
2,555
3,205
6.66
8.78
15.19
16.74
Florida
330
408
8.85
9.45
13.72
16.90
Arizona
149
193
6.91
10.46
20.89
18.57
Texas
125
154
2.02
1.94
2.81
2.56
Minnesota
91
108
5.39
4.15
9.57
7.58
Other
3,654
4,361
4.53
5.06
7.48
6.46
Total
6,904
8,429
5.54
6.74
10.90
11.17
Total core and liquidating portfolios $
117,494
123,827
3.37
3.58
4.08
3.88
(1)
Consists predominantly of real estate 1-4 family junior lien mortgages and first and junior lines of credit secured by real estate, excluding PCI loans.
(2) Includes $1.7 billion and $1.8 billion at December 31, 2010 and 2009, respectively, associated with the Pick-a-Pay portfolio.
CREDIT CARDS Our credit card portfolio totaled $22.3 billion at
December 31, 2010, which represented 3% of our total
outstanding loans and was smaller than the credit card portfolios
of each of our large bank peers. Delinquencies of 30 days or
more were 4.4% of credit card outstandings at
December 31, 2010, down from 5.5% a year ago. Net charge-offs
were 9.7% for 2010, down from 10.8% in 2009, reflecting
previous risk mitigation efforts and overall economic
improvements.
63