Wells Fargo 2010 Annual Report Download - page 136
Download and view the complete annual report
Please find page 136 of the 2010 Wells Fargo annual report below. You can navigate through the pages in the report by either clicking on the pages listed below, or by using the keyword search tool below to find specific information within the annual report.-
 1
1 -
2
-
3
-
4
-
5
-
6
-
7
-
8
-
9
-
10
-
11
-
12
-
13
-
14
-
15
-
16
-
17
-
18
-
19
-
20
-
21
-
22
-
23
-
24
-
25
-
26
-
27
-
28
-
29
-
30
-
31
-
32
-
33
-
34
-
35
-
36
-
37
-
38
-
39
-
40
-
41
-
42
-
43
-
44
-
45
-
46
-
47
-
48
-
49
-
50
-
51
-
52
-
53
-
54
-
55
-
56
-
57
-
58
-
59
-
60
-
61
-
62
-
63
-
64
-
65
-
66
-
67
-
68
-
69
-
70
-
71
-
72
-
73
-
74
-
75
-
76
-
77
-
78
-
79
-
80
-
81
-
82
-
83
-
84
-
85
-
86
-
87
-
88
-
89
-
90
-
91
-
92
-
93
-
94
-
95
-
96
-
97
-
98
-
99
-
100
-
101
-
102
-
103
-
104
-
105
-
106
-
107
-
108
-
109
-
110
-
111
-
112
-
113
-
114
-
115
-
116
-
117
-
118
-
119
-
120
-
121
-
122
-
123
-
124
-
125
-
 126
126 -
 127
127 -
 128
128 -
 129
129 -
 130
130 -
 131
131 -
 132
132 -
 133
133 -
 134
134 -
 135
135 -
 136
136 -
 137
137 -
 138
138 -
 139
139 -
 140
140 -
 141
141 -
 142
142 -
 143
143 -
 144
144 -
 145
145 -
 146
146 -
147
-
148
-
149
-
150
-
151
-
152
-
153
-
154
-
155
-
156
-
157
-
158
-
159
-
160
-
161
-
162
-
163
-
164
-
165
-
166
-
167
-
168
-
169
-
170
-
171
-
172
-
173
-
174
-
175
-
176
-
177
-
178
-
179
-
180
-
181
-
182
-
183
-
184
-
185
-
186
-
187
-
188
-
189
-
190
-
191
-
192
-
193
-
194
-
195
-
196
-
197
-
198
-
199
-
200
-
201
-
202
-
203
-
204
-
205
-
206
-
207
-
208
-
209
-
210
-
211
-
212
-
213
-
214
-
215
-
216
-
217
-
218
-
219
-
220
-
221
-
222
-
223
-
224
-
225
-
226
-
227
-
228
-
229
-
230
-
231
-
232
 |
 |

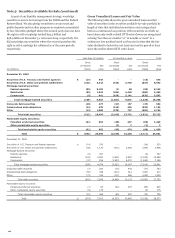
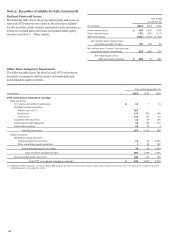
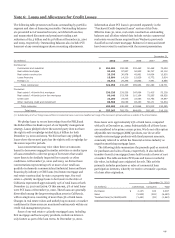
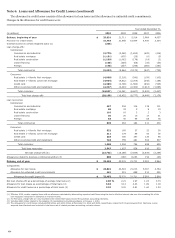
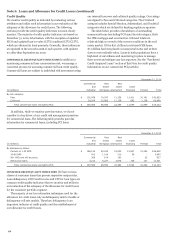
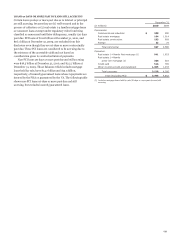
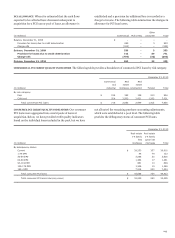
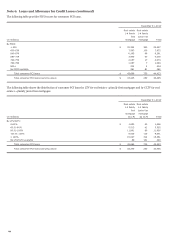
Note 6: Loans and Allowance for Credit Losses (continued)
The allowance for credit losses consists of the allowance for loan losses and the allowance for unfunded credit commitments.
Changes in the allowance for credit losses were:
Year ended December 31,
(in millions)
2010
2009
2008
2007
2006
Balance, beginning of year $
25,031
21,711
5,518
3,964
4,057
Provision for credit losses
15,753
21,668
15,979
4,939
2,204
Interest income on certain impaired loans (1)
(266)
-
-
-
-
Loan charge-offs:
Commercial:
Commercial and industrial
(2,775)
(3,365)
(1,653)
(629)
(414)
Real estate mortgage
(1,151)
(670)
(29)
(6)
(5)
Real estate construction
(1,189)
(1,063)
(178)
(14)
(2)
Lease financing
(120)
(229)
(65)
(33)
(30)
Foreign
(198)
(237)
(245)
(265)
(281)
Total commercial
(5,433)
(5,564)
(2,170)
(947)
(732)
Consumer:
Real estate 1-4 family first mortgage
(4,900)
(3,318)
(540)
(109)
(103)
Real estate 1-4 family junior lien mortgage
(4,934)
(4,812)
(2,204)
(648)
(154)
Credit card
(2,396)
(2,708)
(1,563)
(832)
(505)
Other revolving credit and installment
(2,437)
(3,423)
(2,300)
(1,913)
(1,685)
Total consumer
(14,667)
(14,261)
(6,607)
(3,502)
(2,447)
Total loan charge-offs
(20,100)
(19,825)
(8,777)
(4,449)
(3,179)
Loan recoveries:
Commercial:
Commercial and industrial
427
254
114
119
111
Real estate mortgage
68
33
5
8
19
Real estate construction
110
16
3
2
3
Lease financing
20
20
13
17
21
Foreign
53
40
49
65
76
Total commercial
678
363
184
211
230
Consumer:
Real estate 1-4 family first mortgage
522
185
37
22
26
Real estate 1-4 family junior lien mortgage
211
174
89
53
36
Credit card
218
180
147
120
96
Other revolving credit and installment
718
755
481
504
537
Total consumer
1,669
1,294
754
699
695
Total loan recoveries
2,347
1,657
938
910
925
Net loan charge-offs (2)
(17,753)
(18,168)
(7,839)
(3,539)
(2,254)
Allowances related to business combinations/other (3)
698
(180)
8,053
154
(43)
Balance, end of year $
23,463
25,031
21,711
5,518
3,964
Components:
Allowance for loan losses $
23,022
24,516
21,013
5,307
3,764
Allowance for unfunded credit commitments
441
515
698
211
200
Allowance for credit losses (4) $
23,463
25,031
21,711
5,518
3,964
Net loan charge-offs as a percentage of average total loans (2)
2.30
% 2.21
1.97
1.03
0.73
Allowance for loan losses as a percentage of total loans (4)
3.04
3.13
2.43
1.39
1.18
Allowance for credit losses as a percentage of total loans (4)
3.10
3.20
2.51
1.44
1.24
(1) Effective 2010, certain impaired loans with an allowance calculated by discounting expected cash flows using the loan’s effective interest rate over the remaining life of the
loan recognize reductions in allowance as interest income.
(2) For PCI loans, charge-offs are only recorded to the extent that losses exceed the purchase accounting estimates.
(3) Includes $693 million related to the adoption of consolidation accounting guidance on January 1, 2010.
(4) The allowance for credit losses includes $298 million and $333 million at December 31, 2010 and 2009, respectively, related to PCI loans acquired from Wachovia. Loans
acquired from Wachovia are included in total loans net of related purchase accounting net write-downs.
134