Wells Fargo 2010 Annual Report Download - page 207
Download and view the complete annual report
Please find page 207 of the 2010 Wells Fargo annual report below. You can navigate through the pages in the report by either clicking on the pages listed below, or by using the keyword search tool below to find specific information within the annual report.-
 1
1 -
2
-
3
-
4
-
5
-
6
-
7
-
8
-
9
-
10
-
11
-
12
-
13
-
14
-
15
-
16
-
17
-
18
-
19
-
20
-
21
-
22
-
23
-
24
-
25
-
26
-
27
-
28
-
29
-
30
-
31
-
32
-
33
-
34
-
35
-
36
-
37
-
38
-
39
-
40
-
41
-
42
-
43
-
44
-
45
-
46
-
47
-
48
-
49
-
50
-
51
-
52
-
53
-
54
-
55
-
56
-
57
-
58
-
59
-
60
-
61
-
62
-
63
-
64
-
65
-
66
-
67
-
68
-
69
-
70
-
71
-
72
-
73
-
74
-
75
-
76
-
77
-
78
-
79
-
80
-
81
-
82
-
83
-
84
-
85
-
86
-
87
-
88
-
89
-
90
-
91
-
92
-
93
-
94
-
95
-
96
-
97
-
98
-
99
-
100
-
101
-
102
-
103
-
104
-
105
-
106
-
107
-
108
-
109
-
110
-
111
-
112
-
113
-
114
-
115
-
116
-
117
-
118
-
119
-
120
-
121
-
122
-
123
-
124
-
125
-
126
-
127
-
128
-
129
-
130
-
131
-
132
-
133
-
134
-
135
-
136
-
137
-
138
-
139
-
140
-
141
-
142
-
143
-
144
-
145
-
146
-
147
-
148
-
149
-
150
-
151
-
152
-
153
-
154
-
155
-
156
-
157
-
158
-
159
-
160
-
161
-
162
-
163
-
164
-
165
-
166
-
167
-
168
-
169
-
170
-
171
-
172
-
173
-
174
-
175
-
176
-
177
-
178
-
179
-
180
-
181
-
182
-
183
-
184
-
185
-
186
-
187
-
188
-
189
-
190
-
191
-
192
-
193
-
194
-
195
-
196
-
 197
197 -
 198
198 -
 199
199 -
 200
200 -
 201
201 -
 202
202 -
 203
203 -
 204
204 -
 205
205 -
 206
206 -
 207
207 -
 208
208 -
 209
209 -
 210
210 -
 211
211 -
 212
212 -
 213
213 -
 214
214 -
 215
215 -
 216
216 -
 217
217 -
218
-
219
-
220
-
221
-
222
-
223
-
224
-
225
-
226
-
227
-
228
-
229
-
230
-
231
-
232
 |
 |

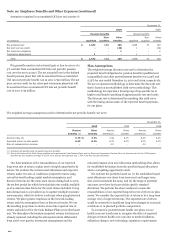
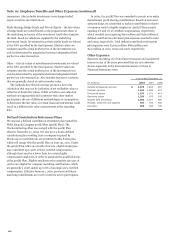
and Medicare cost shifting. In determining the end of year
benefit obligation we assume average annual increases of
approximately 8.0% for health care costs in 2011. This rate is
assumed to trend down 0.25% per year until the trend rate
reaches an ultimate rate of 5.0% in 2023. The 2010 periodic
benefit cost was determined using initial annual trend rates of
8.5% (before age 65) and 8.0% (after age 65). These rates were
assumed to decrease 0.5% per year until they reached ultimate
rates of 5% in 2017 (before age 65) and 2016 (after age 65).
Increasing the assumed health care trend by one percentage
point in each year would increase the benefit obligation as of
December 31, 2010, by $80 million and the total of the interest
cost and service cost components of the net periodic benefit cost
for 2010 by $5 million. Decreasing the assumed health care
trend by one percentage point in each year would decrease the
benefit obligation as of December 31, 2010, by $71 million and
the total of the interest cost and service cost components of the
net periodic benefit cost for 2010 by $4 million.
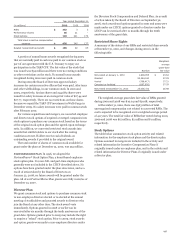
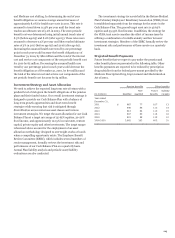
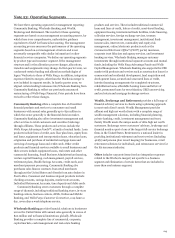
Investment Strategy and Asset Allocation
We seek to achieve the expected long-term rate of return with a
prudent level of risk given the benefit obligations of the pension
plans and their funded status. Our overall investment strategy is
designed to provide our Cash Balance Plan with a balance of
long-term growth opportunities and short-term benefit
strategies while ensuring that risk is mitigated through
diversification across numerous asset classes and various
investment strategies. We target the asset allocation for our Cash
Balance Plan at a target mix range of 35-65% equities, 30-50%
fixed income, and approximately 10-15% in real estate, venture
capital, private equity and other investments. The target ranges
referenced above account for the employment of an asset
allocation methodology designed to overweight stocks or bonds
when a compelling opportunity exists. The Employee Benefit
Review Committee (EBRC), which includes several members of
senior management, formally reviews the investment risk and
performance of our Cash Balance Plan on a quarterly basis.
Annual Plan liability analysis and periodic asset/liability
evaluations are also conducted.
The investment strategy for assets held in the Retiree Medical
Plan Voluntary Employees' Beneficiary Association (VEBA) trust
is established separately from the strategy for the assets in the
Cash Balance Plan. The general target asset mix is 45-65%
equities and 35-55% fixed income. In addition, the strategy for
the VEBA trust assets considers the effect of income taxes by
utilizing a combination of variable annuity and low turnover
investment strategies. Members of the EBRC formally review the
investment risk and performance of these assets on a quarterly
basis.
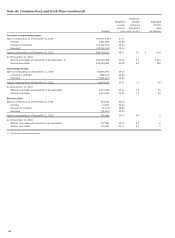
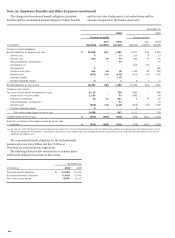
Projected Benefit Payments
Future benefits that we expect to pay under the pension and
other benefit plans are presented in the following table. Other
benefits payments are expected to be reduced by prescription
drug subsidies from the federal government provided by the
Medicare Prescription Drug, Improvement and Modernization
Act of 2003.
Pension benefits
Other benefits
Non-
Future
Subsidy
(in millions) Qualified
qualified
benefits
receipts
Year ended
December 31,
2011 $ 867
77
107
13
2012 846
68
110
14
2013 813
64
113
15
2014 807
63
116
16
2015 801
58
119
10
2016-2020 3,682
293
602
51
205