Wells Fargo 2010 Annual Report Download - page 213
Download and view the complete annual report
Please find page 213 of the 2010 Wells Fargo annual report below. You can navigate through the pages in the report by either clicking on the pages listed below, or by using the keyword search tool below to find specific information within the annual report.-
 1
1 -
2
-
3
-
4
-
5
-
6
-
7
-
8
-
9
-
10
-
11
-
12
-
13
-
14
-
15
-
16
-
17
-
18
-
19
-
20
-
21
-
22
-
23
-
24
-
25
-
26
-
27
-
28
-
29
-
30
-
31
-
32
-
33
-
34
-
35
-
36
-
37
-
38
-
39
-
40
-
41
-
42
-
43
-
44
-
45
-
46
-
47
-
48
-
49
-
50
-
51
-
52
-
53
-
54
-
55
-
56
-
57
-
58
-
59
-
60
-
61
-
62
-
63
-
64
-
65
-
66
-
67
-
68
-
69
-
70
-
71
-
72
-
73
-
74
-
75
-
76
-
77
-
78
-
79
-
80
-
81
-
82
-
83
-
84
-
85
-
86
-
87
-
88
-
89
-
90
-
91
-
92
-
93
-
94
-
95
-
96
-
97
-
98
-
99
-
100
-
101
-
102
-
103
-
104
-
105
-
106
-
107
-
108
-
109
-
110
-
111
-
112
-
113
-
114
-
115
-
116
-
117
-
118
-
119
-
120
-
121
-
122
-
123
-
124
-
125
-
126
-
127
-
128
-
129
-
130
-
131
-
132
-
133
-
134
-
135
-
136
-
137
-
138
-
139
-
140
-
141
-
142
-
143
-
144
-
145
-
146
-
147
-
148
-
149
-
150
-
151
-
152
-
153
-
154
-
155
-
156
-
157
-
158
-
159
-
160
-
161
-
162
-
163
-
164
-
165
-
166
-
167
-
168
-
169
-
170
-
171
-
172
-
173
-
174
-
175
-
176
-
177
-
178
-
179
-
180
-
181
-
182
-
183
-
184
-
185
-
186
-
187
-
188
-
189
-
190
-
191
-
192
-
193
-
194
-
195
-
196
-
197
-
198
-
199
-
200
-
201
-
202
-
 203
203 -
 204
204 -
 205
205 -
 206
206 -
 207
207 -
 208
208 -
 209
209 -
 210
210 -
 211
211 -
 212
212 -
 213
213 -
 214
214 -
 215
215 -
 216
216 -
 217
217 -
 218
218 -
 219
219 -
 220
220 -
 221
221 -
 222
222 -
 223
223 -
224
-
225
-
226
-
227
-
228
-
229
-
230
-
231
-
232
 |
 |

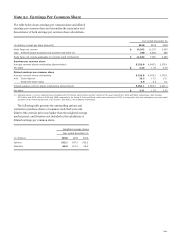
The table below shows earnings per common share and diluted
earnings per common share and reconciles the numerator and
denominator of both earnings per common share calculations.
Note 21: Earnings Per Common Share
Year ended December 31,
(in millions, except per share amounts) 2010
2009
2008
Wells Fargo net income $ 12,362
12,275
2,655
Less: Preferred stock dividends and accretion and other (1) 730
4,285
286
Wells Fargo net income applicable to common stock (numerator) $ 11,632
7,990
2,369
Earnings per common share
Average common shares outstanding (denominator) 5,226.8
4,545.2
3,378.1
Per share $ 2.23
1.76
0.70
Diluted earnings per common share
Average common shares outstanding 5,226.8
4,545.2
3,378.1
Add:
Stock Options 28.3
17.2
13.1
Restricted share rights 8.0
0.3
0.1
Diluted average common shares outstanding (denominator) 5,263.1
4,562.7
3,391.3
Per share $ 2.21
1.75
0.70
(1) Includes Series J, K and L preferred stock dividends of $737 million, $804 million and $67 million for the year ended 2010, 2009 and 2008, respectively. Also includes
$3.5 billion and $219 million in 2009 and 2008, respectively, for Series D Preferred Stock, which was redeemed in 2009. In conjunction with the redemption, we accelerated
accretion of the remaining discount of $1.9 billion. See Note 17 for additional information.
The following table presents the outstanding options and
warrants to purchase shares of common stock that were anti-
dilutive (the exercise price was higher than the weighted-average
market price), and therefore not included in the calculation of
diluted earnings per common share.
Weighted-
average shares
Year ended December 31,
(in millions) 2010
2009
2008
Options 212.1
247.2
169.3
Warrants 66.9
110.3
25.4
211