Wells Fargo 2010 Annual Report Download - page 6
Download and view the complete annual report
Please find page 6 of the 2010 Wells Fargo annual report below. You can navigate through the pages in the report by either clicking on the pages listed below, or by using the keyword search tool below to find specific information within the annual report.-
 1
1 -
 2
2 -
 3
3 -
 4
4 -
 5
5 -
 6
6 -
 7
7 -
 8
8 -
 9
9 -
 10
10 -
 11
11 -
 12
12 -
 13
13 -
 14
14 -
 15
15 -
 16
16 -
 17
17 -
18
-
19
-
20
-
21
-
22
-
23
-
24
-
25
-
26
-
27
-
28
-
29
-
30
-
31
-
32
-
33
-
34
-
35
-
36
-
37
-
38
-
39
-
40
-
41
-
42
-
43
-
44
-
45
-
46
-
47
-
48
-
49
-
50
-
51
-
52
-
53
-
54
-
55
-
56
-
57
-
58
-
59
-
60
-
61
-
62
-
63
-
64
-
65
-
66
-
67
-
68
-
69
-
70
-
71
-
72
-
73
-
74
-
75
-
76
-
77
-
78
-
79
-
80
-
81
-
82
-
83
-
84
-
85
-
86
-
87
-
88
-
89
-
90
-
91
-
92
-
93
-
94
-
95
-
96
-
97
-
98
-
99
-
100
-
101
-
102
-
103
-
104
-
105
-
106
-
107
-
108
-
109
-
110
-
111
-
112
-
113
-
114
-
115
-
116
-
117
-
118
-
119
-
120
-
121
-
122
-
123
-
124
-
125
-
126
-
127
-
128
-
129
-
130
-
131
-
132
-
133
-
134
-
135
-
136
-
137
-
138
-
139
-
140
-
141
-
142
-
143
-
144
-
145
-
146
-
147
-
148
-
149
-
150
-
151
-
152
-
153
-
154
-
155
-
156
-
157
-
158
-
159
-
160
-
161
-
162
-
163
-
164
-
165
-
166
-
167
-
168
-
169
-
170
-
171
-
172
-
173
-
174
-
175
-
176
-
177
-
178
-
179
-
180
-
181
-
182
-
183
-
184
-
185
-
186
-
187
-
188
-
189
-
190
-
191
-
192
-
193
-
194
-
195
-
196
-
197
-
198
-
199
-
200
-
201
-
202
-
203
-
204
-
205
-
206
-
207
-
208
-
209
-
210
-
211
-
212
-
213
-
214
-
215
-
216
-
217
-
218
-
219
-
220
-
221
-
222
-
223
-
224
-
225
-
226
-
227
-
228
-
229
-
230
-
231
-
232
 |
 |

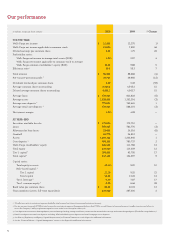
Our performance
inmillionsexceptpershareamounts Change
FORTHEYEAR
WellsFargonetincome
WellsFargonetincomeapplicabletocommonstock
Dilutedearningspercommonshare
Profitabilityratios
WellsFargonetincometoaveragetotalassets(ROA)
WellsFargonetincomeapplicabletocommonstocktoaverage
WellsFargocommonstockholders’equity(ROE)
Eciencyratio
Totalrevenue ()
Pretaxpreprovisionprofit ()
Dividendsdeclaredpercommonshare ()
Averagecommonsharesoutstanding
Dilutedaveragecommonsharesoutstanding
Averageloans ()
Averageassets ()
Averagecoredeposits
Averageretailcoredeposits ()
Netinterestmargin —
ATYEAREND
Securitiesavailableforsale —
Loans ()
Allowanceforloanlosses ()
Goodwill —
Assets
Coredeposits
WellsFargostockholders’equity
Totalequity
Tiercapital
Totalcapital
Capitalratios
Totalequitytoassets
Riskbasedcapital
Tiercapital
Totalcapital
Tierleverage
Tiercommonequity
Bookvaluepercommonshare
Teammembers(activefulltimeequivalent)
1 The eciency ratio is noninterest expense divided by total revenue (net interest income and noninterest income).
2 Pre-tax pre-provision profit (PTPP) is total revenue less noninterest expense. Management believes that PTPP is a useful financial measure because it enables investors and others to
assess the Company’s ability to generate capital to cover credit losses through a credit cycle.
3 Core deposits are noninterest-bearing deposits, interest-bearing checking, savings certificates, certain market rate and other savings, and certain foreign deposits (Eurodollar sweep balances).
4 Retail core deposits are total core deposits excluding Wholesale Banking core deposits and retail mortgage escrow deposits.
5 See Note 25 (Regulatory and Agency Capital Requirements) to Financial Statements in this Report for additional information.
6 See the “Financial Review – Capital Management” section in this Report for additional information.