Wells Fargo 2010 Annual Report Download - page 125
Download and view the complete annual report
Please find page 125 of the 2010 Wells Fargo annual report below. You can navigate through the pages in the report by either clicking on the pages listed below, or by using the keyword search tool below to find specific information within the annual report.-
 1
1 -
2
-
3
-
4
-
5
-
6
-
7
-
8
-
9
-
10
-
11
-
12
-
13
-
14
-
15
-
16
-
17
-
18
-
19
-
20
-
21
-
22
-
23
-
24
-
25
-
26
-
27
-
28
-
29
-
30
-
31
-
32
-
33
-
34
-
35
-
36
-
37
-
38
-
39
-
40
-
41
-
42
-
43
-
44
-
45
-
46
-
47
-
48
-
49
-
50
-
51
-
52
-
53
-
54
-
55
-
56
-
57
-
58
-
59
-
60
-
61
-
62
-
63
-
64
-
65
-
66
-
67
-
68
-
69
-
70
-
71
-
72
-
73
-
74
-
75
-
76
-
77
-
78
-
79
-
80
-
81
-
82
-
83
-
84
-
85
-
86
-
87
-
88
-
89
-
90
-
91
-
92
-
93
-
94
-
95
-
96
-
97
-
98
-
99
-
100
-
101
-
102
-
103
-
104
-
105
-
106
-
107
-
108
-
109
-
110
-
111
-
112
-
113
-
114
-
 115
115 -
 116
116 -
 117
117 -
 118
118 -
 119
119 -
 120
120 -
 121
121 -
 122
122 -
 123
123 -
 124
124 -
 125
125 -
 126
126 -
 127
127 -
 128
128 -
 129
129 -
 130
130 -
 131
131 -
 132
132 -
 133
133 -
 134
134 -
 135
135 -
136
-
137
-
138
-
139
-
140
-
141
-
142
-
143
-
144
-
145
-
146
-
147
-
148
-
149
-
150
-
151
-
152
-
153
-
154
-
155
-
156
-
157
-
158
-
159
-
160
-
161
-
162
-
163
-
164
-
165
-
166
-
167
-
168
-
169
-
170
-
171
-
172
-
173
-
174
-
175
-
176
-
177
-
178
-
179
-
180
-
181
-
182
-
183
-
184
-
185
-
186
-
187
-
188
-
189
-
190
-
191
-
192
-
193
-
194
-
195
-
196
-
197
-
198
-
199
-
200
-
201
-
202
-
203
-
204
-
205
-
206
-
207
-
208
-
209
-
210
-
211
-
212
-
213
-
214
-
215
-
216
-
217
-
218
-
219
-
220
-
221
-
222
-
223
-
224
-
225
-
226
-
227
-
228
-
229
-
230
-
231
-
232
 |
 |

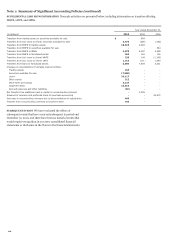
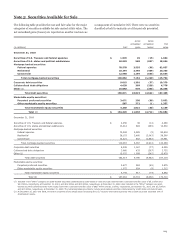
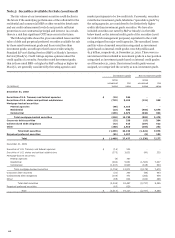
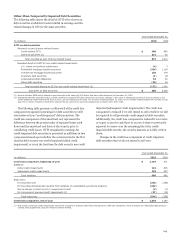
The following table provides the cost and fair value for the major
categories of securities available for sale carried at fair value. The
net unrealized gains (losses) are reported on an after-tax basis as
a component of cumulative OCI. There were no securities
classified as held to maturity as of the periods presented.
Note 5: Securities Available for Sale
Gross
Gross
unrealized
unrealized
Fair
(in millions)
Cost
gains
losses
value
December 31, 2010
Securities of U.S. Treasury and federal agencies $ 1,570
49
(15)
1,604
Securities of U.S. states and political subdivisions 18,923
568
(837)
18,654
Mortgage-backed securities:
Federal agencies 78,578
3,555
(96)
82,037
Residential 18,294
2,398
(489)
20,203
Commercial 12,990
1,199
(635)
13,554
Total mortgage-backed securities 109,862
7,152
(1,220)
115,794
Corporate debt securities 9,015
1,301
(37)
10,279
Collateralized debt obligations 4,638
369
(229)
4,778
Other (1) 16,063
576
(283)
16,356
Total debt securities 160,071
10,015
(2,621)
167,465
Marketable equity securities:
Perpetual preferred securities 3,671
250
(89)
3,832
Other marketable equity securities 587
771
(1)
1,357
Total marketable equity securities 4,258
1,021
(90)
5,189
Total (2) $ 164,329
11,036
(2,711)
172,654
December 31, 2009
Securities of U.S. Treasury and federal agencies $ 2,256
38
(14)
2,280
Securities of U.S. states and political subdivisions 13,212
683
(365)
13,530
Mortgage-backed securities:
Federal agencies 79,542
3,285
(9)
82,818
Residential 28,153
2,480
(2,043)
28,590
Commercial 12,221
602
(1,862)
10,961
Total mortgage-backed securities 119,916
6,367
(3,914)
122,369
Corporate debt securities 8,245
1,167
(77)
9,335
Collateralized debt obligations 3,660
432
(367)
3,725
Other (1) 15,025
1,099
(245)
15,879
Total debt securities 162,314
9,786
(4,982)
167,118
Marketable equity securities:
Perpetual preferred securities 3,677
263
(65)
3,875
Other marketable equity securities 1,072
654
(9)
1,717
Total marketable equity securities 4,749
917
(74)
5,592
Total (2) $ 167,063
10,703
(5,056)
172,710
(1) Included in the “Other” category are asset-backed securities collateralized by auto leases or loans and cash reserves with a cost basis and fair value of $6.2 billion and
$6.4 billion, respectively, at December 31, 2010, and $8.2 billion and $8.5 billion, respectively, at December 31, 2009. Also included in the "Other" category are asset-
backed securities collateralized by home equity loans with a cost basis and fair value of $927 million and $1.1 billion, respectively, at December 31, 2010, and $2.3 billion
and $2.5 billion, respectively, at December 31, 2009. The remaining balances primarily include asset-backed securities collateralized by credit cards and student loans.
(2) At December 31, 2010 and 2009, we held no securities of any single issuer (excluding the U.S. Treasury and federal agencies) with a book value that exceeded 10% of
stockholders’ equity.
123