Wells Fargo 2010 Annual Report Download - page 76
Download and view the complete annual report
Please find page 76 of the 2010 Wells Fargo annual report below. You can navigate through the pages in the report by either clicking on the pages listed below, or by using the keyword search tool below to find specific information within the annual report.-
 1
1 -
2
-
3
-
4
-
5
-
6
-
7
-
8
-
9
-
10
-
11
-
12
-
13
-
14
-
15
-
16
-
17
-
18
-
19
-
20
-
21
-
22
-
23
-
24
-
25
-
26
-
27
-
28
-
29
-
30
-
31
-
32
-
33
-
34
-
35
-
36
-
37
-
38
-
39
-
40
-
41
-
42
-
43
-
44
-
45
-
46
-
47
-
48
-
49
-
50
-
51
-
52
-
53
-
54
-
55
-
56
-
57
-
58
-
59
-
60
-
61
-
62
-
63
-
64
-
65
-
 66
66 -
 67
67 -
 68
68 -
 69
69 -
 70
70 -
 71
71 -
 72
72 -
 73
73 -
 74
74 -
 75
75 -
 76
76 -
 77
77 -
 78
78 -
 79
79 -
 80
80 -
 81
81 -
 82
82 -
 83
83 -
 84
84 -
 85
85 -
 86
86 -
87
-
88
-
89
-
90
-
91
-
92
-
93
-
94
-
95
-
96
-
97
-
98
-
99
-
100
-
101
-
102
-
103
-
104
-
105
-
106
-
107
-
108
-
109
-
110
-
111
-
112
-
113
-
114
-
115
-
116
-
117
-
118
-
119
-
120
-
121
-
122
-
123
-
124
-
125
-
126
-
127
-
128
-
129
-
130
-
131
-
132
-
133
-
134
-
135
-
136
-
137
-
138
-
139
-
140
-
141
-
142
-
143
-
144
-
145
-
146
-
147
-
148
-
149
-
150
-
151
-
152
-
153
-
154
-
155
-
156
-
157
-
158
-
159
-
160
-
161
-
162
-
163
-
164
-
165
-
166
-
167
-
168
-
169
-
170
-
171
-
172
-
173
-
174
-
175
-
176
-
177
-
178
-
179
-
180
-
181
-
182
-
183
-
184
-
185
-
186
-
187
-
188
-
189
-
190
-
191
-
192
-
193
-
194
-
195
-
196
-
197
-
198
-
199
-
200
-
201
-
202
-
203
-
204
-
205
-
206
-
207
-
208
-
209
-
210
-
211
-
212
-
213
-
214
-
215
-
216
-
217
-
218
-
219
-
220
-
221
-
222
-
223
-
224
-
225
-
226
-
227
-
228
-
229
-
230
-
231
-
232
 |
 |

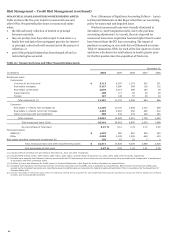
Risk Management – Credit Risk Management (continued)
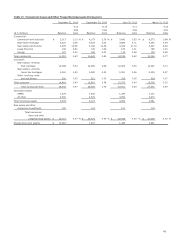
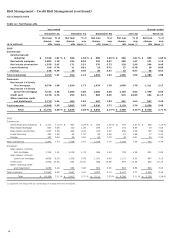
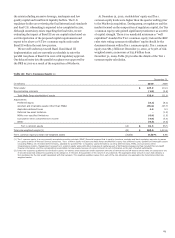
Table 34: Changes in Mortgage Repurchase Liability
Quarter ended
Dec. 31,
Sept. 30,
June 30,
Mar. 31,
Year ended December 31,
(in millions) 2010
2010
2010
2010
2010
2009
Balance, beginning of period $ 1,331
1,375
1,263
1,033
1,033
620
(1)
Provision for repurchase losses:
Loan sales 35
29
36
44
144
302
Change in estimate - primarily due to credit deterioration 429
341
346
358
1,474
625
Total additions 464
370
382
402
1,618
927
Losses (506)
(414)
(270)
(172)
(1,362)
(514)
Balance, end of period $ 1,289
1,331
1,375
1,263
1,289
1,033
(1) Reflects purchase accounting refinements.
The mortgage repurchase liability of $1.3 billion at
December 31, 2010, represents our best estimate of the probable
loss that we may incur for various representations and
warranties in the contractual provisions of our sales of mortgage
loans. There may be a range of reasonably possible losses in
excess of the estimated liability that cannot be estimated with
confidence. Because the level of mortgage loan repurchase losses
depends upon economic factors, investor demand strategies and
other external conditions that may change over the life of the
underlying loans, the level of the liability for mortgage loan
repurchase losses is difficult to estimate and requires
considerable management judgment. We maintain regular
contact with the GSEs and other significant investors to monitor
and address their repurchase demand practices and concerns.
For additional information on our repurchase liability, see the
“Critical Accounting Policies – Liability for Mortgage Loan
Repurchase Losses” section and Note 9 (Mortgage Banking
Activities) to Financial Statements in this Report.
The repurchase liability is only applicable to loans we
originated and sold with representations and warranties. Most of
these loans are included in our servicing portfolio. Our
repurchase liability estimate involves consideration of many
factors that influence the key assumptions of what our
repurchase volume may be and what loss on average we may
incur. Those key assumptions and the sensitivity of the liability
to immediate adverse changes in them at December 31, 2010, are
presented in Table 35.
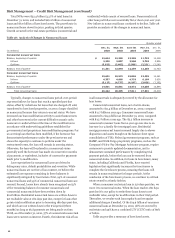
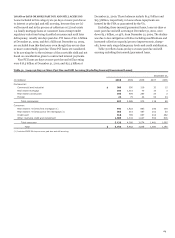
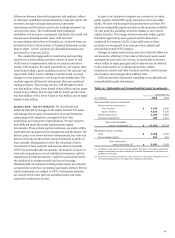
Table 35: Mortgage Repurchase Liability –
Sensitivity/Assumptions
Mortgage
repurchase
(in millions) liability
Balance at December 31, 2010 $ 1,289
Loss on repurchases (1) 36.0
%
Increase in liability from:
10% higher losses $ 145
25% higher losses 362
Repurchase rate assumption 0.3
%
Increase in liability from:
10% higher repurchase rates $ 108
25% higher repurchase rates 269
(1) Represents total estimated average loss rate on repurchased loans, net of
recovery from third party originators, based on historical experience and current
economic conditions. The average loss rate includes the impact of repurchased
loans for which no loss is expected to be realized.
To the extent that economic conditions and the housing
market do not recover or future investor repurchase demands
and appeals success rates differ from past experience, we could
continue to have increased demands and increased loss severity
on repurchases, causing future additions to the repurchase
liability. However, some of the underwriting standards that were
permitted by the GSEs for conforming loans in the 2006 through
2008 vintages, which significantly contributed to recent levels of
repurchase demands, were tightened starting in mid to late
2008. Accordingly, we do not expect a similar rate of repurchase
requests from the 2009 and prospective vintages, absent
deterioration in economic conditions or changes in investor
behavior.
74