Wells Fargo 2010 Annual Report Download - page 205
Download and view the complete annual report
Please find page 205 of the 2010 Wells Fargo annual report below. You can navigate through the pages in the report by either clicking on the pages listed below, or by using the keyword search tool below to find specific information within the annual report.-
 1
1 -
2
-
3
-
4
-
5
-
6
-
7
-
8
-
9
-
10
-
11
-
12
-
13
-
14
-
15
-
16
-
17
-
18
-
19
-
20
-
21
-
22
-
23
-
24
-
25
-
26
-
27
-
28
-
29
-
30
-
31
-
32
-
33
-
34
-
35
-
36
-
37
-
38
-
39
-
40
-
41
-
42
-
43
-
44
-
45
-
46
-
47
-
48
-
49
-
50
-
51
-
52
-
53
-
54
-
55
-
56
-
57
-
58
-
59
-
60
-
61
-
62
-
63
-
64
-
65
-
66
-
67
-
68
-
69
-
70
-
71
-
72
-
73
-
74
-
75
-
76
-
77
-
78
-
79
-
80
-
81
-
82
-
83
-
84
-
85
-
86
-
87
-
88
-
89
-
90
-
91
-
92
-
93
-
94
-
95
-
96
-
97
-
98
-
99
-
100
-
101
-
102
-
103
-
104
-
105
-
106
-
107
-
108
-
109
-
110
-
111
-
112
-
113
-
114
-
115
-
116
-
117
-
118
-
119
-
120
-
121
-
122
-
123
-
124
-
125
-
126
-
127
-
128
-
129
-
130
-
131
-
132
-
133
-
134
-
135
-
136
-
137
-
138
-
139
-
140
-
141
-
142
-
143
-
144
-
145
-
146
-
147
-
148
-
149
-
150
-
151
-
152
-
153
-
154
-
155
-
156
-
157
-
158
-
159
-
160
-
161
-
162
-
163
-
164
-
165
-
166
-
167
-
168
-
169
-
170
-
171
-
172
-
173
-
174
-
175
-
176
-
177
-
178
-
179
-
180
-
181
-
182
-
183
-
184
-
185
-
186
-
187
-
188
-
189
-
190
-
191
-
192
-
193
-
194
-
 195
195 -
 196
196 -
 197
197 -
 198
198 -
 199
199 -
 200
200 -
 201
201 -
 202
202 -
 203
203 -
 204
204 -
 205
205 -
 206
206 -
 207
207 -
 208
208 -
 209
209 -
 210
210 -
 211
211 -
 212
212 -
 213
213 -
 214
214 -
 215
215 -
216
-
217
-
218
-
219
-
220
-
221
-
222
-
223
-
224
-
225
-
226
-
227
-
228
-
229
-
230
-
231
-
232
 |
 |

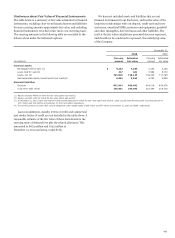
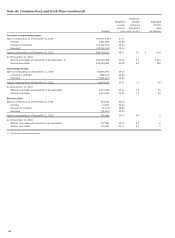
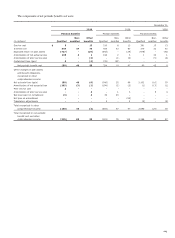
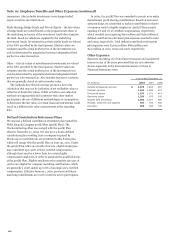
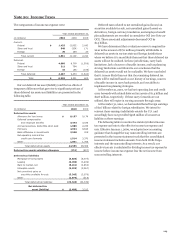
The components of net periodic benefit cost were:
December 31,
2010
2009
2008
Pension benefits
Pension benefits
Pension benefits
Non-
Other
Non-
Other
Non-
Other
(in millions)
Qualified
qualified
benefits
Qualified
qualified
benefits
Qualified
qualified
benefits
Service cost $
5
-
13
210
8
13
291
15
13
Interest cost 554
37
78
595
43
83
276
22
40
Expected return on plan assets (717)
-
(29)
(643)
-
(29)
(478)
-
(41)
Amortization of net actuarial loss 105
3
1
194
2
3
1
13
1
Amortization of prior service cost -
-
(4)
-
(1)
(3)
-
(5)
(4)
Curtailment loss (gain) 3
-
(4)
(32)
(33)
-
-
-
-
Net periodic benefit cost
(50)
40
55
324
19
67
90
45
9
Other changes in plan assets
and benefit obligations
recognized in other
comprehensive income:
Net actuarial loss (gain) (59)
46
(9)
(346)
25
99
2,102
(16)
79
Amortization of net actuarial loss (105)
(3)
(1)
(194)
(2)
(3)
(1)
(13)
(1)
Prior service cost 2
-
-
-
-
-
-
-
-
Amortization of prior service cost -
-
4
-
1
3
-
5
4
Net loss (gain) in curtailment (3)
-
4
32
33
-
-
-
-
Net gain on amendment -
-
-
-
-
(54)
-
-
-
Translation adjustments -
-
-
3
-
2
(5)
-
(4)
Total recognized in other
comprehensive income
(165)
43
(2)
(505)
57
47
2,096
(24)
78
Total recognized in net periodic
benefit cost and other
comprehensive income $
(215)
83
53
(181)
76
114
2,186
21
87
203