Wells Fargo 2010 Annual Report Download - page 179
Download and view the complete annual report
Please find page 179 of the 2010 Wells Fargo annual report below. You can navigate through the pages in the report by either clicking on the pages listed below, or by using the keyword search tool below to find specific information within the annual report.-
 1
1 -
2
-
3
-
4
-
5
-
6
-
7
-
8
-
9
-
10
-
11
-
12
-
13
-
14
-
15
-
16
-
17
-
18
-
19
-
20
-
21
-
22
-
23
-
24
-
25
-
26
-
27
-
28
-
29
-
30
-
31
-
32
-
33
-
34
-
35
-
36
-
37
-
38
-
39
-
40
-
41
-
42
-
43
-
44
-
45
-
46
-
47
-
48
-
49
-
50
-
51
-
52
-
53
-
54
-
55
-
56
-
57
-
58
-
59
-
60
-
61
-
62
-
63
-
64
-
65
-
66
-
67
-
68
-
69
-
70
-
71
-
72
-
73
-
74
-
75
-
76
-
77
-
78
-
79
-
80
-
81
-
82
-
83
-
84
-
85
-
86
-
87
-
88
-
89
-
90
-
91
-
92
-
93
-
94
-
95
-
96
-
97
-
98
-
99
-
100
-
101
-
102
-
103
-
104
-
105
-
106
-
107
-
108
-
109
-
110
-
111
-
112
-
113
-
114
-
115
-
116
-
117
-
118
-
119
-
120
-
121
-
122
-
123
-
124
-
125
-
126
-
127
-
128
-
129
-
130
-
131
-
132
-
133
-
134
-
135
-
136
-
137
-
138
-
139
-
140
-
141
-
142
-
143
-
144
-
145
-
146
-
147
-
148
-
149
-
150
-
151
-
152
-
153
-
154
-
155
-
156
-
157
-
158
-
159
-
160
-
161
-
162
-
163
-
164
-
165
-
166
-
167
-
168
-
 169
169 -
 170
170 -
 171
171 -
 172
172 -
 173
173 -
 174
174 -
 175
175 -
 176
176 -
 177
177 -
 178
178 -
 179
179 -
 180
180 -
 181
181 -
 182
182 -
 183
183 -
 184
184 -
 185
185 -
 186
186 -
 187
187 -
 188
188 -
 189
189 -
190
-
191
-
192
-
193
-
194
-
195
-
196
-
197
-
198
-
199
-
200
-
201
-
202
-
203
-
204
-
205
-
206
-
207
-
208
-
209
-
210
-
211
-
212
-
213
-
214
-
215
-
216
-
217
-
218
-
219
-
220
-
221
-
222
-
223
-
224
-
225
-
226
-
227
-
228
-
229
-
230
-
231
-
232
 |
 |

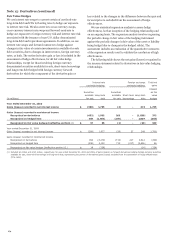
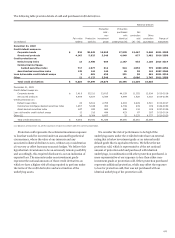
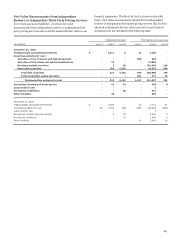
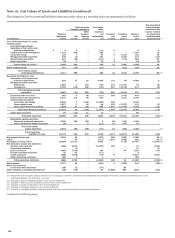
The following table provides details of sold and purchased credit derivatives.
Notional amount
Protection
Protection
sold -
purchased
Net
non-
with
protection
Other
Fair value
Protection
investment
identical
sold
protection
Range of
(in millions)
liability
sold (A)
grade
underlyings (B)
(A) - (B)
purchased
maturities
December 31, 2010
Credit default swaps on:
Corporate bonds $ 810
30,445
16,360
17,978
12,467
9,440
2011-2020
Structured products 4,145
5,825
5,246
4,948
877
2,482
2016-2056
Credit protection on:
Default swap index 12
2,700
909
2,167
533
1,106
2011-2017
Commercial mortgage-
backed securities index 717
1,977
612
924
1,053
779
2049-2052
Asset-backed securities index 128
144
144
46
98
142
2037-2046
Loan deliverable credit default swaps 2
481
456
391
90
261
2011-2014
Other 12
6,127
5,348
41
6,086
2,745
2011-2056
Total credit derivatives $ 5,826
47,699
29,075
26,495
21,204
16,955
December 31, 2009
Credit default swaps on:
Corporate bonds $ 2,419
55,511
23,815
44,159
11,352
12,634
2010-2018
Structured products 4,498
6,627
5,084
4,999
1,628
3,018
2014-2056
Credit protection on:
Default swap index 23
6,611
2,765
4,202
2,409
2,510
2010-2017
Commercial mortgage-backed securities index 1,987
5,188
453
4,749
439
189
2049-2052
Asset-backed securities index 637
830
660
696
134
189
2037-2046
Loan deliverable credit default swaps 12
510
494
423
87
287
2010-2014
Other (1) 16
9,264
8,657
32
9,232
4,757
2010-2020
Total credit derivatives $ 9,592
84,541
41,928
59,260
25,281
23,584
(1) Balances at December 31, 2009, have been revised to conform with the current presentation.
Protection sold represents the estimated maximum exposure
to loss that would be incurred under an assumed hypothetical
circumstance, where the value of our interests and any
associated collateral declines to zero, without any consideration
of recovery or offset from any economic hedges. We believe this
hypothetical circumstance to be an extremely remote possibility
and accordingly, this required disclosure is not an indication of
expected loss. The amounts under non-investment grade
represent the notional amounts of those credit derivatives on
which we have a higher risk of being required to perform under
the terms of the credit derivative and are a function of the
underlying assets.
We consider the risk of performance to be high if the
underlying assets under the credit derivative have an external
rating that is below investment grade or an internal credit
default grade that is equivalent thereto. We believe the net
protection sold, which is representative of the net notional
amount of protection sold and purchased with identical
underlyings, in combination with other protection purchased, is
more representative of our exposure to loss than either non-
investment grade or protection sold. Other protection purchased
represents additional protection, which may offset the exposure
to loss for protection sold, that was not purchased with an
identical underlying of the protection sold.
177