Wells Fargo 2010 Annual Report Download - page 224
Download and view the complete annual report
Please find page 224 of the 2010 Wells Fargo annual report below. You can navigate through the pages in the report by either clicking on the pages listed below, or by using the keyword search tool below to find specific information within the annual report.-
 1
1 -
2
-
3
-
4
-
5
-
6
-
7
-
8
-
9
-
10
-
11
-
12
-
13
-
14
-
15
-
16
-
17
-
18
-
19
-
20
-
21
-
22
-
23
-
24
-
25
-
26
-
27
-
28
-
29
-
30
-
31
-
32
-
33
-
34
-
35
-
36
-
37
-
38
-
39
-
40
-
41
-
42
-
43
-
44
-
45
-
46
-
47
-
48
-
49
-
50
-
51
-
52
-
53
-
54
-
55
-
56
-
57
-
58
-
59
-
60
-
61
-
62
-
63
-
64
-
65
-
66
-
67
-
68
-
69
-
70
-
71
-
72
-
73
-
74
-
75
-
76
-
77
-
78
-
79
-
80
-
81
-
82
-
83
-
84
-
85
-
86
-
87
-
88
-
89
-
90
-
91
-
92
-
93
-
94
-
95
-
96
-
97
-
98
-
99
-
100
-
101
-
102
-
103
-
104
-
105
-
106
-
107
-
108
-
109
-
110
-
111
-
112
-
113
-
114
-
115
-
116
-
117
-
118
-
119
-
120
-
121
-
122
-
123
-
124
-
125
-
126
-
127
-
128
-
129
-
130
-
131
-
132
-
133
-
134
-
135
-
136
-
137
-
138
-
139
-
140
-
141
-
142
-
143
-
144
-
145
-
146
-
147
-
148
-
149
-
150
-
151
-
152
-
153
-
154
-
155
-
156
-
157
-
158
-
159
-
160
-
161
-
162
-
163
-
164
-
165
-
166
-
167
-
168
-
169
-
170
-
171
-
172
-
173
-
174
-
175
-
176
-
177
-
178
-
179
-
180
-
181
-
182
-
183
-
184
-
185
-
186
-
187
-
188
-
189
-
190
-
191
-
192
-
193
-
194
-
195
-
196
-
197
-
198
-
199
-
200
-
201
-
202
-
203
-
204
-
205
-
206
-
207
-
208
-
209
-
210
-
211
-
212
-
213
-
 214
214 -
 215
215 -
 216
216 -
 217
217 -
 218
218 -
 219
219 -
 220
220 -
 221
221 -
 222
222 -
 223
223 -
 224
224 -
 225
225 -
 226
226 -
 227
227 -
 228
228 -
 229
229 -
 230
230 -
 231
231 -
 232
232
 |
 |

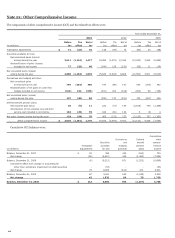
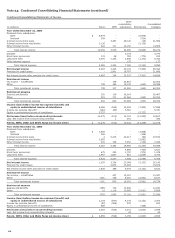
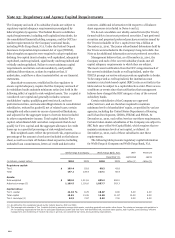
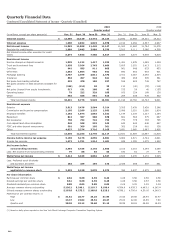
Quarterly Financial Data
Condensed Consolidated Statement of Income - Quarterly (Unaudited)
2010
2009
Quarter ended
Quarter ended
(in millions, except per share amounts) Dec. 31
Sept. 30
June 30
Mar. 31
Dec. 31
Sept. 30
June 30
Mar. 31
Interest income $ 12,969
13,130
13,472
13,225
13,692
13,968
14,301
14,313
Interest expense 1,906
2,032
2,023
2,078
2,192
2,284
2,537
2,937
Net interest income 11,063
11,098
11,449
11,147
11,500
11,684
11,764
11,376
Provision for credit losses 2,989
3,445
3,989
5,330
5,913
6,111
5,086
4,558
Net interest income after provision for credit
losses 8,074
7,653
7,460
5,817
5,587
5,573
6,678
6,818
Noninterest income
Service charges on deposit accounts 1,035
1,132
1,417
1,332
1,421
1,478
1,448
1,394
Trust and investment fees 2,958
2,564
2,743
2,669
2,605
2,502
2,413
2,215
Card fees 941
935
911
865
961
946
923
853
Other fees 1,063
1,004
982
941
990
950
963
901
Mortgage banking 2,757
2,499
2,011
2,470
3,411
3,067
3,046
2,504
Insurance 564
397
544
621
482
468
595
581
Net gains from trading activities 532
470
109
537
516
622
749
787
Net gains (losses) on debt securities available for
sale
(268)
(114)
30
28
110
(40)
(78)
(119)
Net gains (losses) from equity investments 317
131
288
43
273
29
40
(157)
Operating leases 79
222
329
185
163
224
168
130
Other 453
536
581
610
264
536
476
552
Total noninterest income 10,431
9,776
9,945
10,301
11,196
10,782
10,743
9,641
Noninterest expense
Salaries 3,513
3,478
3,564
3,314
3,505
3,428
3,438
3,386
Commission and incentive compensation 2,195
2,280
2,225
1,992
2,086
2,051
2,060
1,824
Employee benefits 1,192
1,074
1,063
1,322
1,144
1,034
1,227
1,284
Equipment 813
557
588
678
681
563
575
687
Net occupancy 750
742
742
796
770
778
783
796
Core deposit and other intangibles 549
548
553
549
642
642
646
647
FDIC and other deposit assessments 301
300
295
301
302
228
981
338
Other 4,027
3,274
3,716
3,165
3,691
2,960
2,987
2,856
Total noninterest expense 13,340
12,253
12,746
12,117
12,821
11,684
12,697
11,818
Income before income tax expense 5,165
5,176
4,659
4,001
3,962
4,671
4,724
4,641
Income tax expense 1,672
1,751
1,514
1,401
949
1,355
1,475
1,552
Net income before
noncontrolling interests 3,493
3,425
3,145
2,600
3,013
3,316
3,249
3,089
Less: Net income from noncontrolling interests
79
86
83
53
190
81
77
44
Wells Fargo net income $ 3,414
3,339
3,062
2,547
2,823
3,235
3,172
3,045
Less: Preferred stock dividends
and accretion and other 182
189
184
175
2,429
598
597
661
Wells Fargo net income
applicable to common stock $ 3,232
3,150
2,878
2,372
394
2,637
2,575
2,384
Per share information
Earnings per common share $ 0.62
0.60
0.55
0.46
0.08
0.56
0.58
0.56
Diluted earnings per common share 0.61
0.60
0.55
0.45
0.08
0.56
0.57
0.56
Dividends declared per common share 0.05
0.05
0.05
0.05
0.05
0.05
0.05
0.34
Average common shares outstanding 5,256.2
5,240.1
5,219.7
5,190.4
4,764.8
4,678.3
4,483.1
4,247.4
Diluted average common shares outstanding 5,293.8
5,273.2
5,260.8
5,225.2
4,796.1
4,706.4
4,501.6
4,249.3
Market price per common share (1)
High $ 31.61
28.77
34.25
31.99
31.53
29.56
28.45
30.47
Low 23.37
23.02
25.52
26.37
25.00
22.08
13.65
7.80
Quarter-end 30.99
25.12
25.60
31.12
26.99
28.18
24.26
14.24
(1) Based on daily prices reported on the New York Stock Exchange Composite Transaction Reporting System.
222