Wells Fargo 2010 Annual Report Download - page 190
Download and view the complete annual report
Please find page 190 of the 2010 Wells Fargo annual report below. You can navigate through the pages in the report by either clicking on the pages listed below, or by using the keyword search tool below to find specific information within the annual report.-
 1
1 -
2
-
3
-
4
-
5
-
6
-
7
-
8
-
9
-
10
-
11
-
12
-
13
-
14
-
15
-
16
-
17
-
18
-
19
-
20
-
21
-
22
-
23
-
24
-
25
-
26
-
27
-
28
-
29
-
30
-
31
-
32
-
33
-
34
-
35
-
36
-
37
-
38
-
39
-
40
-
41
-
42
-
43
-
44
-
45
-
46
-
47
-
48
-
49
-
50
-
51
-
52
-
53
-
54
-
55
-
56
-
57
-
58
-
59
-
60
-
61
-
62
-
63
-
64
-
65
-
66
-
67
-
68
-
69
-
70
-
71
-
72
-
73
-
74
-
75
-
76
-
77
-
78
-
79
-
80
-
81
-
82
-
83
-
84
-
85
-
86
-
87
-
88
-
89
-
90
-
91
-
92
-
93
-
94
-
95
-
96
-
97
-
98
-
99
-
100
-
101
-
102
-
103
-
104
-
105
-
106
-
107
-
108
-
109
-
110
-
111
-
112
-
113
-
114
-
115
-
116
-
117
-
118
-
119
-
120
-
121
-
122
-
123
-
124
-
125
-
126
-
127
-
128
-
129
-
130
-
131
-
132
-
133
-
134
-
135
-
136
-
137
-
138
-
139
-
140
-
141
-
142
-
143
-
144
-
145
-
146
-
147
-
148
-
149
-
150
-
151
-
152
-
153
-
154
-
155
-
156
-
157
-
158
-
159
-
160
-
161
-
162
-
163
-
164
-
165
-
166
-
167
-
168
-
169
-
170
-
171
-
172
-
173
-
174
-
175
-
176
-
177
-
178
-
179
-
 180
180 -
 181
181 -
 182
182 -
 183
183 -
 184
184 -
 185
185 -
 186
186 -
 187
187 -
 188
188 -
 189
189 -
 190
190 -
 191
191 -
 192
192 -
 193
193 -
 194
194 -
 195
195 -
 196
196 -
 197
197 -
 198
198 -
 199
199 -
 200
200 -
201
-
202
-
203
-
204
-
205
-
206
-
207
-
208
-
209
-
210
-
211
-
212
-
213
-
214
-
215
-
216
-
217
-
218
-
219
-
220
-
221
-
222
-
223
-
224
-
225
-
226
-
227
-
228
-
229
-
230
-
231
-
232
 |
 |

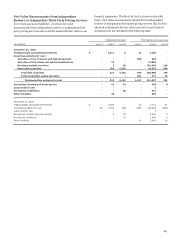
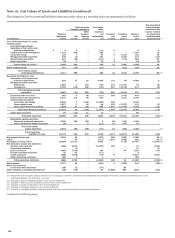
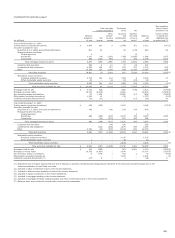
Note 16: Fair Values of Assets and Liabilities (continued)
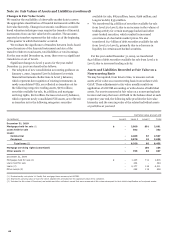
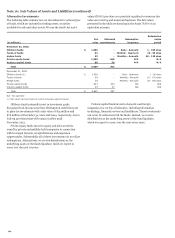
Changes in Fair Value Levels
We monitor the availability of observable market data to assess
the appropriate classification of financial instruments within the
fair value hierarchy. Changes in economic conditions or model-
based valuation techniques may require the transfer of financial
instruments from one fair value level to another. The amounts
reported as transfers represent the fair value as of the beginning
of the quarter in which the transfer occurred.
We evaluate the significance of transfers between levels based
upon the nature of the financial instrument and size of the
transfer relative to total assets, total liabilities or total earnings.
For the year ended December 31, 2010, there were no significant
transfers in or out of Level 1.
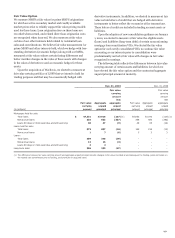
Significant changes to Level 3 assets for the year ended
December 31, 2010 are described as follows:
• Our adoption of new consolidation accounting guidance on
January 1, 2010, impacted Level 3 balances for certain
financial instruments. Reductions in Level 3 balances,
which represent derecognition of existing investments in
newly consolidated VIEs, are reflected as transfers out for
the following categories: trading assets, $276 million;
securities available for sale, $1.9 billion; and mortgage
servicing rights, $118 million. Increases in Level 3 balances,
which represent newly consolidated VIE assets, are reflected
as transfers in for the following categories: securities
available for sale, $829 million; loans, $366 million; and
long-term debt, $359 million.
• We transferred $4.9 billion of securities available for sale
from Level 3 to Level 2 due to an increase in the volume of
trading activity for certain mortgage-backed and other
asset-backed securities, which resulted in increased
occurrences of observable market prices. We also
transferred $1.7 billion of debt securities available for sale
from Level 2 to Level 3, primarily due to a decrease in
liquidity for certain asset-backed securities.
For the year ended December 31, 2009, we transferred
$4.0 billion of debt securities available for sale from Level 3 to
Level 2 due to increased trading activity.
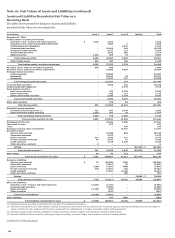
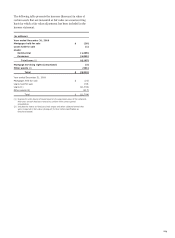
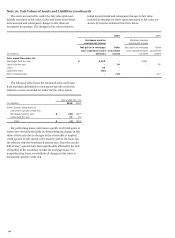
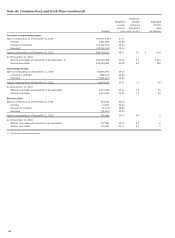
Assets and Liabilities Recorded at Fair Value on a
Nonrecurring Basis
We may be required, from time to time, to measure certain
assets at fair value on a nonrecurring basis in accordance with
GAAP. These adjustments to fair value usually result from
application of LOCOM accounting or write-downs of individual
assets. For assets measured at fair value on a nonrecurring basis
in 2010 and 2009 that were still held in the balance sheet at each
respective year end, the following table provides the fair value
hierarchy and the carrying value of the related individual assets
or portfolios at year end.
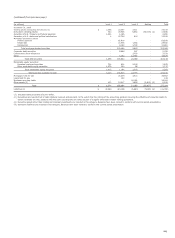
Carrying value at year end
(in millions)
Level 1
Level 2
Level 3
Total
December 31, 2010
Mortgages held for sale (1) $
-
2,000
891
2,891
Loans held for sale -
352
-
352
Loans:
Commercial -
2,480
67
2,547
Consumer -
5,870
18
5,888
Total loans (2) -
8,350
85
8,435
Mortgage servicing rights (amortized) -
-
104
104
Other assets (3) -
765
82
847
December 31, 2009
Mortgages held for sale (1) $ -
1,105
711
1,816
Loans held for sale
-
444
-
444
Loans (2)
-
6,177
134
6,311
Other assets (3)
-
289
119
408
(1) Predominantly real estate 1-4 family first mortgage loans measured at LOCOM.
(2) Represents carrying value of loans for which adjustments are based on the appraised value of the collateral.
(3) Includes the fair value of foreclosed real estate and other collateral owned that were measured at fair value subsequent to their initial classification as foreclosed assets.
188