Wells Fargo 2010 Annual Report Download - page 74
Download and view the complete annual report
Please find page 74 of the 2010 Wells Fargo annual report below. You can navigate through the pages in the report by either clicking on the pages listed below, or by using the keyword search tool below to find specific information within the annual report.-
 1
1 -
2
-
3
-
4
-
5
-
6
-
7
-
8
-
9
-
10
-
11
-
12
-
13
-
14
-
15
-
16
-
17
-
18
-
19
-
20
-
21
-
22
-
23
-
24
-
25
-
26
-
27
-
28
-
29
-
30
-
31
-
32
-
33
-
34
-
35
-
36
-
37
-
38
-
39
-
40
-
41
-
42
-
43
-
44
-
45
-
46
-
47
-
48
-
49
-
50
-
51
-
52
-
53
-
54
-
55
-
56
-
57
-
58
-
59
-
60
-
61
-
62
-
63
-
 64
64 -
 65
65 -
 66
66 -
 67
67 -
 68
68 -
 69
69 -
 70
70 -
 71
71 -
 72
72 -
 73
73 -
 74
74 -
 75
75 -
 76
76 -
 77
77 -
 78
78 -
 79
79 -
 80
80 -
 81
81 -
 82
82 -
 83
83 -
 84
84 -
85
-
86
-
87
-
88
-
89
-
90
-
91
-
92
-
93
-
94
-
95
-
96
-
97
-
98
-
99
-
100
-
101
-
102
-
103
-
104
-
105
-
106
-
107
-
108
-
109
-
110
-
111
-
112
-
113
-
114
-
115
-
116
-
117
-
118
-
119
-
120
-
121
-
122
-
123
-
124
-
125
-
126
-
127
-
128
-
129
-
130
-
131
-
132
-
133
-
134
-
135
-
136
-
137
-
138
-
139
-
140
-
141
-
142
-
143
-
144
-
145
-
146
-
147
-
148
-
149
-
150
-
151
-
152
-
153
-
154
-
155
-
156
-
157
-
158
-
159
-
160
-
161
-
162
-
163
-
164
-
165
-
166
-
167
-
168
-
169
-
170
-
171
-
172
-
173
-
174
-
175
-
176
-
177
-
178
-
179
-
180
-
181
-
182
-
183
-
184
-
185
-
186
-
187
-
188
-
189
-
190
-
191
-
192
-
193
-
194
-
195
-
196
-
197
-
198
-
199
-
200
-
201
-
202
-
203
-
204
-
205
-
206
-
207
-
208
-
209
-
210
-
211
-
212
-
213
-
214
-
215
-
216
-
217
-
218
-
219
-
220
-
221
-
222
-
223
-
224
-
225
-
226
-
227
-
228
-
229
-
230
-
231
-
232
 |
 |
Risk Management – Credit Risk Management (continued)
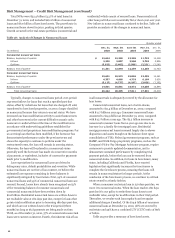
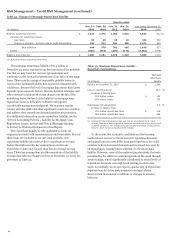
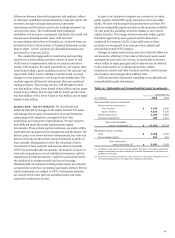
Total provision for credit losses was $15.8 billion in 2010,
$21.7 billion in 2009 and $16.0 billion in 2008. The 2010
provision was $2.0 billion less than credit losses, compared with
a provision that was $3.5 billion in excess of credit losses in
2009. Absent significant deterioration in the economy, we
expect future reductions in the allowance for credit losses.
Primary drivers of the 2010 provision reduction were
continued improvement in the consumer portfolios and related
loss estimates and improvement in management’s view of
economic conditions. These drivers were partially offset by an
increase in impaired loans and related allowance primarily
associated with increased consumer loan modification efforts
and a $693 million adjustment due to adoption of consolidation
accounting guidance on January 1, 2010.
In 2009, the provision of $21.7 billion included a provision in
excess of credit losses of $3.5 billion, which was primarily driven
by three factors: (1) deterioration in economic conditions that
increased the projected losses in our commercial portfolios,
(2) additional allowance associated with loan modification
programs designed to keep qualifying borrowers in their homes,
and (3) the establishment of additional allowance for PCI loans.
In 2008, the provision of $16.0 billion included a provision
in excess of credit losses of $8.1 billion, which included
$3.9 billion to conform loss emergence coverage periods to the
most conservative of legacy Wells Fargo and Wachovia within
Federal Financial Institutions Examination Council guidelines.
The remainder of the allowance build was attributable to higher
projected loss rates across the majority of the consumer credit
businesses, and some credit deterioration and growth in the
wholesale portfolios.
In determining the appropriate allowance attributable to our
residential real estate portfolios, the loss rates used in our
analysis include the impact of our established loan modification
programs. When modifications occur or are probable to occur,
our allowance considers the impact of these modifications,
taking into consideration the associated credit cost, including re-
defaults of modified loans and projected loss severity. The loss
content associated with existing and probable loan modifications
has been considered in our allowance reserving methodology.
Changes in the allowance reflect changes in statistically
derived loss estimates, historical loss experience, current trends
in borrower risk and/or general economic activity on portfolio
performance, and management’s estimate for imprecision and
uncertainty.
We believe the allowance for credit losses of $23.5 billion
was adequate to cover credit losses inherent in the loan
portfolio, including unfunded credit commitments, at December
31, 2010. The allowance for credit losses is subject to change and
considers existing factors at the time, including economic or
market conditions and ongoing internal and external
examination processes. Due to the sensitivity of the allowance
for credit losses to changes in the economic environment, it is
possible that unanticipated economic deterioration would create
incremental credit losses not anticipated as of the balance sheet
date. Our process for determining the allowance for credit losses
is discussed in the “Critical Accounting Policies – Allowance for
Credit Losses” section and Note 6 (Loans and Allowance for
Credit Losses) to Financial Statements in this Report.
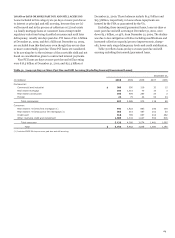
LIABILITY FOR MORTGAGE LOAN REPURCHASE LOSSES We
sell residential mortgage loans to various parties, including (1)
Freddie Mac and Fannie Mae (GSEs) who include the mortgage
loans in GSE-guaranteed mortgage securitizations, (2) SPEs that
issue private label MBS, and (3) other financial institutions that
purchase mortgage loans for investment or private label
securitization. In addition, we pool FHA-insured and VA-
guaranteed mortgage loans that back securities guaranteed by
GNMA. We may be required to repurchase these mortgage
loans, indemnify the securitization trust, investor or insurer, or
reimburse the securitization trust, investor or insurer for credit
losses incurred on loans (collectively “repurchase”) in the event
of a breach of such contractual representations or warranties
that is not remedied within a period (usually 90 days or less)
after we receive notice of the breach.
We establish mortgage repurchase liabilities related to
various representations and warranties that reflect
management’s estimate of losses for loans for which we could
have repurchase obligation, whether or not we currently service
those loans, based on a combination of factors. Currently,
repurchase demands primarily relate to 2006 through 2008
vintages and to GSE-guaranteed MBS.
During 2010, we continued to experience elevated levels of
repurchase activity measured by number of loans, investor
repurchase demands and our level of repurchases. We
repurchased or reimbursed investors for incurred losses on
mortgage loans with balances of $2.6 billion. Additionally, in
2010, we negotiated global settlements on pools of mortgage
loans of $675 million, which effectively eliminates the risk of
repurchase on these loans from our outstanding servicing
portfolio. We incurred net losses on repurchased loans, investor
reimbursements and loan pool global settlements totaling
$1.4 billion in 2010.
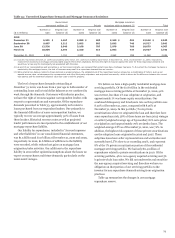
Adjustments made to our mortgage repurchase liability in
recent periods have incorporated the increase in repurchase
demands, mortgage insurance rescissions, and higher than
anticipated losses on repurchased loans that we have
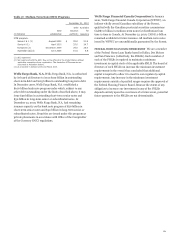
experienced. Table 33 provides the number of unresolved
repurchase demands and mortgage insurance rescissions. We
generally do not have unresolved repurchase demands from the
FHA and VA for loans in GNMA-guaranteed securities because
those demands are relatively few and we quickly resolve them.
72