Wells Fargo 2010 Annual Report Download - page 36
Download and view the complete annual report
Please find page 36 of the 2010 Wells Fargo annual report below. You can navigate through the pages in the report by either clicking on the pages listed below, or by using the keyword search tool below to find specific information within the annual report.-
 1
1 -
2
-
3
-
4
-
5
-
6
-
7
-
8
-
9
-
10
-
11
-
12
-
13
-
14
-
15
-
16
-
17
-
18
-
19
-
20
-
21
-
22
-
23
-
24
-
25
-
 26
26 -
 27
27 -
 28
28 -
 29
29 -
 30
30 -
 31
31 -
 32
32 -
 33
33 -
 34
34 -
 35
35 -
 36
36 -
 37
37 -
 38
38 -
 39
39 -
 40
40 -
 41
41 -
 42
42 -
 43
43 -
 44
44 -
 45
45 -
 46
46 -
47
-
48
-
49
-
50
-
51
-
52
-
53
-
54
-
55
-
56
-
57
-
58
-
59
-
60
-
61
-
62
-
63
-
64
-
65
-
66
-
67
-
68
-
69
-
70
-
71
-
72
-
73
-
74
-
75
-
76
-
77
-
78
-
79
-
80
-
81
-
82
-
83
-
84
-
85
-
86
-
87
-
88
-
89
-
90
-
91
-
92
-
93
-
94
-
95
-
96
-
97
-
98
-
99
-
100
-
101
-
102
-
103
-
104
-
105
-
106
-
107
-
108
-
109
-
110
-
111
-
112
-
113
-
114
-
115
-
116
-
117
-
118
-
119
-
120
-
121
-
122
-
123
-
124
-
125
-
126
-
127
-
128
-
129
-
130
-
131
-
132
-
133
-
134
-
135
-
136
-
137
-
138
-
139
-
140
-
141
-
142
-
143
-
144
-
145
-
146
-
147
-
148
-
149
-
150
-
151
-
152
-
153
-
154
-
155
-
156
-
157
-
158
-
159
-
160
-
161
-
162
-
163
-
164
-
165
-
166
-
167
-
168
-
169
-
170
-
171
-
172
-
173
-
174
-
175
-
176
-
177
-
178
-
179
-
180
-
181
-
182
-
183
-
184
-
185
-
186
-
187
-
188
-
189
-
190
-
191
-
192
-
193
-
194
-
195
-
196
-
197
-
198
-
199
-
200
-
201
-
202
-
203
-
204
-
205
-
206
-
207
-
208
-
209
-
210
-
211
-
212
-
213
-
214
-
215
-
216
-
217
-
218
-
219
-
220
-
221
-
222
-
223
-
224
-
225
-
226
-
227
-
228
-
229
-
230
-
231
-
232
 |
 |

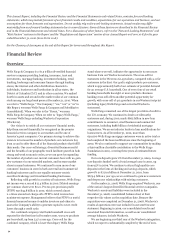
This Annual Report, including the Financial Review and the Financial Statements and related Notes, contains forward-looking
statements, which may include forecasts of our financial results and condition, expectations for our operations and business, and our
assumptions for those forecasts and expectations. Do not unduly rely on forward-looking statements. Actual results may differ
materially from our forward-looking statements due to several factors. Some of these factors are described in the Financial Review
and in the Financial Statements and related Notes. For a discussion of other factors, refer to the “Forward-Looking Statements” and
“Risk Factors” sections in this Report and the “Regulation and Supervision” section of our Annual Report on Form 10-K for the year
ended December 31, 2010 (2010 Form 10-K).
See the Glossary of Acronyms at the end of this Report for terms used throughout this Report.
Financial Review
Wells Fargo & Company is a $1.3 trillion diversified financial
services company providing banking, insurance, trust and
investments, mortgage banking, investment banking, retail
banking, brokerage and consumer finance through banking
stores, the internet and other distribution channels to
individuals, businesses and institutions in all 50 states, the
District of Columbia (D.C.) and in other countries. We ranked
fourth in assets and second in the market value of our common
stock among our large bank peers at December 31, 2010. When
we refer to “Wells Fargo,” “the Company,” “we,” “our” or “us” in
this Report, we mean Wells Fargo & Company and Subsidiaries
(consolidated). When we refer to the “Parent,” we mean
Wells Fargo & Company. When we refer to “legacy Wells Fargo,”
we mean Wells Fargo excluding Wachovia Corporation
(Wachovia).
Overview
Our vision is to satisfy all our customers’ financial needs,
help them succeed financially, be recognized as the premier
financial services company in our markets and be one of
America’s great companies. Our primary strategy to achieve this
vision is to increase the number of products our customers buy
from us and to offer them all of the financial products that fulfill
their needs. Our cross-sell strategy, diversified business model
and the breadth of our geographic reach facilitate growth in both
strong and weak economic cycles, as we can grow by expanding
the number of products our current customers have with us, gain
new customers in our extended markets, and increase market
share in many businesses. We continued to earn more of our
customers’ business in 2010 in both our retail and commercial
banking businesses and in our equally customer-centric
securities brokerage and investment banking businesses.
Reflecting solid growth in a variety of businesses, Wells Fargo
net income was a record $12.4 billion in 2010. Diluted earnings
per common share were $2.21. Pre-tax pre-provision profit
(PTPP) was $34.8 billion in 2010, which covered almost
2.o times annual net charge-offs. PTPP is total revenue less
noninterest expense. Management believes that PTPP is a useful
financial measure because it enables investors and others to
assess the Company's ability to generate capital to cover credit
losses through a credit cycle.
Our combined company retail bank household cross-sell,
reported for the first time in December 2010, was 5.70 products
per household, up from 5.47 a year ago. Cross-sell for the
combined company, which is lower than legacy Wells Fargo
stand-alone cross-sell, indicates the opportunity to earn more
business from our Wachovia customers. The cross-sell for
customers in the West was 6.14 products, compared with 5.11 for
customers in the East. Our goal is eight products per customer,
which is approximately half of our estimate of potential demand
for an average U.S. household. One of every four of our retail
banking households has eight or more products. Business
banking cross-sell offers another potential opportunity for
growth, with cross-sell of 4.04 products in our Western footprint
(including legacy Wells Fargo and converted Wachovia
customers).
Wells Fargo remained one of the largest providers of credit to
the U.S. economy. We continued to lend to creditworthy
customers and, during 2010, made $665 billion in new loan
commitments to consumer, small business and commercial
customers, including $386 billion of residential mortgage
originations. We are an industry leader in loan modifications for
homeowners. As of December 31, 2010, more than
620,000 Wells Fargo mortgage customers were in active trial or
had completed the loan modifications since the beginning of
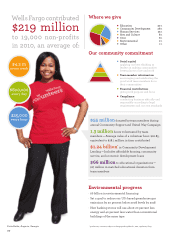
2009. We also continued to support our communities by making
a $400 million charitable contribution to the Wells Fargo
Foundation in 2010, covering three years of estimated future
funding.
Our core deposits grew 2% from December 31, 2009. Average
core deposits funded 100% of total average loans in 2010, up
from 93% in 2009. We continue to attract high quality core
deposits in the form of checking and savings deposits, which
grew 6% to $720.9 billion at December 31, 2010, from
$679.9 billion a year ago, as we continued to gain new customers
and deepen our relationships with existing customers.
On December 31, 2008, Wells Fargo acquired Wachovia, one
of the nation’s largest diversified financial services companies.
Wachovia’s assets and liabilities were included in the
December 31, 2008, consolidated balance sheet at their
respective fair values on the acquisition date. Because the
acquisition was completed on December 31, 2008, Wachovia’s
results of operations were not included in our 2008 income
statement. Beginning in 2009, our consolidated results and
associated financial information, as well as our consolidated
average balances, include Wachovia.
We are beginning our third year of the Wachovia integration,
which we expect to substantially complete by the end of 2011.
34