Wells Fargo 2010 Annual Report Download - page 145
Download and view the complete annual report
Please find page 145 of the 2010 Wells Fargo annual report below. You can navigate through the pages in the report by either clicking on the pages listed below, or by using the keyword search tool below to find specific information within the annual report.-
 1
1 -
2
-
3
-
4
-
5
-
6
-
7
-
8
-
9
-
10
-
11
-
12
-
13
-
14
-
15
-
16
-
17
-
18
-
19
-
20
-
21
-
22
-
23
-
24
-
25
-
26
-
27
-
28
-
29
-
30
-
31
-
32
-
33
-
34
-
35
-
36
-
37
-
38
-
39
-
40
-
41
-
42
-
43
-
44
-
45
-
46
-
47
-
48
-
49
-
50
-
51
-
52
-
53
-
54
-
55
-
56
-
57
-
58
-
59
-
60
-
61
-
62
-
63
-
64
-
65
-
66
-
67
-
68
-
69
-
70
-
71
-
72
-
73
-
74
-
75
-
76
-
77
-
78
-
79
-
80
-
81
-
82
-
83
-
84
-
85
-
86
-
87
-
88
-
89
-
90
-
91
-
92
-
93
-
94
-
95
-
96
-
97
-
98
-
99
-
100
-
101
-
102
-
103
-
104
-
105
-
106
-
107
-
108
-
109
-
110
-
111
-
112
-
113
-
114
-
115
-
116
-
117
-
118
-
119
-
120
-
121
-
122
-
123
-
124
-
125
-
126
-
127
-
128
-
129
-
130
-
131
-
132
-
133
-
134
-
 135
135 -
 136
136 -
 137
137 -
 138
138 -
 139
139 -
 140
140 -
 141
141 -
 142
142 -
 143
143 -
 144
144 -
 145
145 -
 146
146 -
 147
147 -
 148
148 -
 149
149 -
 150
150 -
 151
151 -
 152
152 -
 153
153 -
 154
154 -
 155
155 -
156
-
157
-
158
-
159
-
160
-
161
-
162
-
163
-
164
-
165
-
166
-
167
-
168
-
169
-
170
-
171
-
172
-
173
-
174
-
175
-
176
-
177
-
178
-
179
-
180
-
181
-
182
-
183
-
184
-
185
-
186
-
187
-
188
-
189
-
190
-
191
-
192
-
193
-
194
-
195
-
196
-
197
-
198
-
199
-
200
-
201
-
202
-
203
-
204
-
205
-
206
-
207
-
208
-
209
-
210
-
211
-
212
-
213
-
214
-
215
-
216
-
217
-
218
-
219
-
220
-
221
-
222
-
223
-
224
-
225
-
226
-
227
-
228
-
229
-
230
-
231
-
232
 |
 |

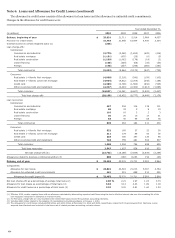
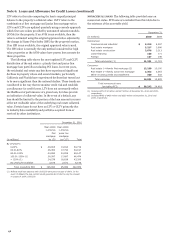
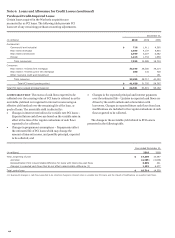
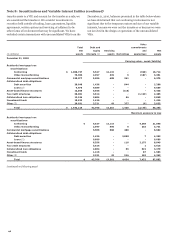
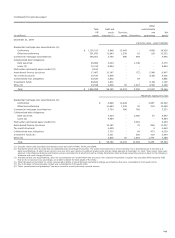
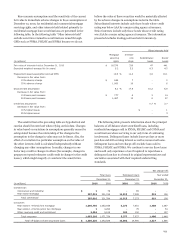
PCI ALLOWANCE When it is estimated that the cash flows
expected to be collected have decreased subsequent to
acquisition for a PCI loan or pool of loans, an allowance is
established and a provision for additional loss is recorded as a
charge to income. The following table summarizes the changes in
allowance for PCI loan losses.
Other
(in millions) Commercial
Pick-a-Pay
consumer
Total
Balance, December 31, 2008 $ -
-
-
-
Provision for losses due to credit deterioration 850
-
3
853
Charge-offs (520)
-
-
(520)
Balance, December 31, 2009 330
-
3
333
Provision for losses due to credit deterioration 712
-
59
771
Charge-offs (776)
-
(30)
(806)
Balance, December 31, 2010 $ 266
-
32
298
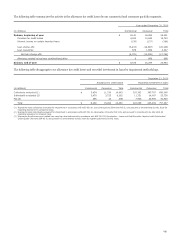
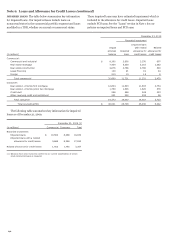
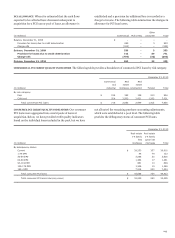
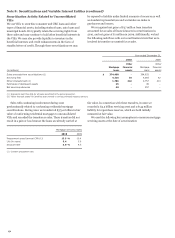
COMMERCIAL PCI CREDIT QUALITY INDICATORS The following table provides a breakdown of commercial PCI loans by risk category.
December 31, 2010
Commercial
Real
Real
and
estate
estate
(in millions) industrial
mortgage
construction
Foreign
Total
By risk category:
Pass $ 214
352
128
210
904
Criticized 504
2,503
2,821
1,203
7,031
Total commercial PCI loans $ 718
2,855
2,949
1,413
7,935
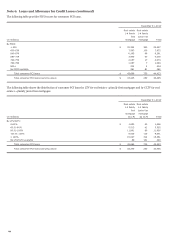
CONSUMER PCI CREDIT QUALITY INDICATORS Our consumer
PCI loans were aggregated into several pools of loans at
acquisition. Below, we have provided credit quality indicators
based on the individual loans included in the pool, but we have
not allocated the remaining purchase accounting adjustments,
which were established at a pool level. The following table
provides the delinquency status of consumer PCI loans.
December 31, 2010
Real estate
Real estate
1-4 family
1-4 family
first
junior lien
(in millions)
mortgage
mortgage
Total
By delinquency status:
Current $
29,253
357
29,610
1-29 DPD
44
79
123
30-59 DPD
3,586
30
3,616
60-89 DPD
1,364
17
1,381
90-119 DPD
881
13
894
120-179 DPD
1,346
19
1,365
180+ DPD
7,214
220
7,434
Total consumer PCI loans $
43,688
735
44,423
Total consumer PCI loans (carrying value) $
33,245
250
33,495
143