Wells Fargo 2010 Annual Report Download - page 50
Download and view the complete annual report
Please find page 50 of the 2010 Wells Fargo annual report below. You can navigate through the pages in the report by either clicking on the pages listed below, or by using the keyword search tool below to find specific information within the annual report.-
 1
1 -
2
-
3
-
4
-
5
-
6
-
7
-
8
-
9
-
10
-
11
-
12
-
13
-
14
-
15
-
16
-
17
-
18
-
19
-
20
-
21
-
22
-
23
-
24
-
25
-
26
-
27
-
28
-
29
-
30
-
31
-
32
-
33
-
34
-
35
-
36
-
37
-
38
-
39
-
 40
40 -
 41
41 -
 42
42 -
 43
43 -
 44
44 -
 45
45 -
 46
46 -
 47
47 -
 48
48 -
 49
49 -
 50
50 -
 51
51 -
 52
52 -
 53
53 -
 54
54 -
 55
55 -
 56
56 -
 57
57 -
 58
58 -
 59
59 -
 60
60 -
61
-
62
-
63
-
64
-
65
-
66
-
67
-
68
-
69
-
70
-
71
-
72
-
73
-
74
-
75
-
76
-
77
-
78
-
79
-
80
-
81
-
82
-
83
-
84
-
85
-
86
-
87
-
88
-
89
-
90
-
91
-
92
-
93
-
94
-
95
-
96
-
97
-
98
-
99
-
100
-
101
-
102
-
103
-
104
-
105
-
106
-
107
-
108
-
109
-
110
-
111
-
112
-
113
-
114
-
115
-
116
-
117
-
118
-
119
-
120
-
121
-
122
-
123
-
124
-
125
-
126
-
127
-
128
-
129
-
130
-
131
-
132
-
133
-
134
-
135
-
136
-
137
-
138
-
139
-
140
-
141
-
142
-
143
-
144
-
145
-
146
-
147
-
148
-
149
-
150
-
151
-
152
-
153
-
154
-
155
-
156
-
157
-
158
-
159
-
160
-
161
-
162
-
163
-
164
-
165
-
166
-
167
-
168
-
169
-
170
-
171
-
172
-
173
-
174
-
175
-
176
-
177
-
178
-
179
-
180
-
181
-
182
-
183
-
184
-
185
-
186
-
187
-
188
-
189
-
190
-
191
-
192
-
193
-
194
-
195
-
196
-
197
-
198
-
199
-
200
-
201
-
202
-
203
-
204
-
205
-
206
-
207
-
208
-
209
-
210
-
211
-
212
-
213
-
214
-
215
-
216
-
217
-
218
-
219
-
220
-
221
-
222
-
223
-
224
-
225
-
226
-
227
-
228
-
229
-
230
-
231
-
232
 |
 |

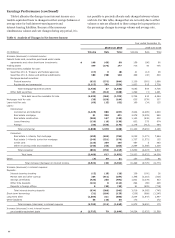
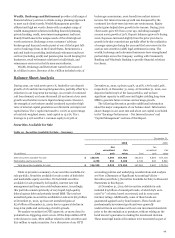
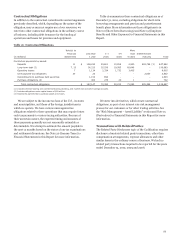
Earnings Performance (continued)
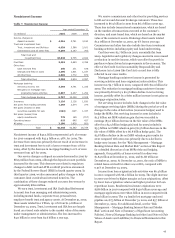
Operating Segment Results
We define our operating segments by product and customer. In
first quarter 2010, we conformed certain funding and allocation
methodologies of Wachovia to those of Wells Fargo; in addition
integration expense related to mergers other than the Wachovia
merger is now included in the segment results. In fourth quarter
2010, we aligned certain lending businesses into Wholesale
Banking from Community Banking to reflect our previously
announced restructuring of Wells Fargo Financial. Prior periods
have been revised to reflect these changes. Table 9 and the
following discussion present our results by operating segment.
For a more complete description of our operating segments,
including additional financial information and the underlying
management accounting process, see Note 23 (Operating
Segments) to Financial Statements in this Report.
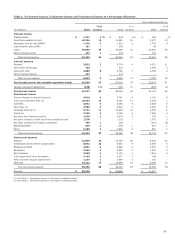
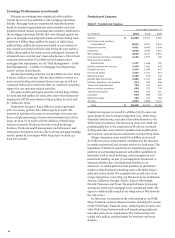
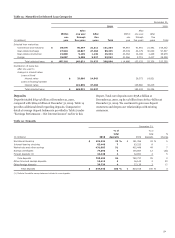
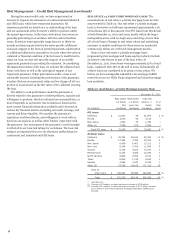
Table 9: Operating Segment Results – Highlights
Year ended December 31,
Wealth, Brokerage
(in billions)
Community Banking
Wholesale Banking
and Retirement
2010
2009
2010
2009
2010
2009
Revenue $ 54.7
60.5
22.2
20.6
11.7
10.8
Net income
7.1
8.9
5.8
3.9
1.0
0.5
Average loans
530.1
552.7
230.5
260.2
43.0
45.7
Average core deposits
536.4
552.8
170.0
147.3
121.2
114.2
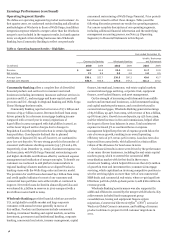
Community Banking offers a complete line of diversified
financial products and services for consumers and small
businesses including investment, insurance and trust services in
39 states and D.C., and mortgage and home equity loans in all
50 states and D.C. through its Regional Banking and Wells Fargo
Home Mortgage business units.
Community Banking reported net income of $7.1 billion and
revenue of $54.7 billion in 2010. Revenue declined from 2009
driven primarily by a decrease in mortgage banking income
compared with a record year in 2009 (originations of
$420 billion in 2009 compared with $384 billion in 2010), as
well as lower deposit service charges due to changes to
Regulation E and the planned reduction in certain liquidating
loan portfolios. Core deposits declined due to planned
certificates of deposit (CD) run-off; however, we continued to
grow low cost deposits. We saw strong growth in the number of
consumer and business checking accounts (up 7.5% and 4.8%,
respectively, from December 31, 2009). Noninterest expense was
flat from 2009, with Wells Fargo Financial restructuring costs
and higher charitable contributions offset by continued expense
management and realization of merger synergies. To benefit our
customers we continued to add platform team members in
regional banking’s Eastern markets as we aligned Wachovia
banking stores with the Wells Fargo sales and service model.
The provision for credit losses decreased $4.1 billion from 2009
and credit quality indicators in most of our consumer and
commercial loan portfolios were either stable or continued to
improve. Net credit losses declined in almost all portfolios and
we released $1.4 billion in reserves in 2010 compared with a
$2.2 billion reserve build in 2009.
Wholesale Banking provides financial solutions across the
U.S. and globally to middle market and large corporate
customers with annual revenue generally in excess of
$20 million. Products and businesses include commercial
banking, investment banking and capital markets, securities
investment, government and institutional banking, corporate
banking, commercial real estate, treasury management, capital
finance, international, insurance, real estate capital markets,
commercial mortgage servicing, corporate trust, equipment
finance, asset backed finance, and asset management.
On the strength of increasing credit demands from middle
market and international businesses, solid investment banking
and capital markets performance, and a modest rebound in
commercial mortgages, Wholesale Banking generated earnings
of $5.8 billion, up 49% from 2009, with revenue of $22.2 billion,
up 8% from 2009. Growth in core deposits, up 15% from 2009,
and the related increase in fees and commissions, helped offset
the impact of lower loan balances in 2010. Total noninterest
expense increased 5% as continued focus on expense
management helped keep the rate of expense growth below the
rate of revenue growth, resulting in an overall operating
efficiency ratio of 51% versus 52% in 2009. Loan loss rates also
improved from 2009 levels, which allowed for a $561 million
release of the allowance for loan losses in 2010.
Our financial results in 2010 were driven by the performance
of our many diverse businesses, including the real estate capital
markets group, which re-entered the commercial MBS
securitization market with its first deal in three years;
investment banking, which helped drive more than $172 million
of growth in trust and investment fees; commercial mortgage
servicing, which capitalized on its strong competitive position to
win the servicing rights on more than 70% of new commercial
MBS deals; and commercial real estate, where re-pricing efforts
lifted loan portfolio yields 49 basis points to add $180 million in
revenue growth.
Wholesale Banking’s performance was also supported by
additional efficiencies created by the merger with Wachovia. Key
achievements included funds management group
consolidations, leasing and equipment finance system
migrations, Commercial Electronic Office® (CEO®) access for
Wachovia Global Connect customers, and building of treasury
product solutions to prepare for full customer migrations in
2011.
48