Wells Fargo 2010 Annual Report Download - page 56
Download and view the complete annual report
Please find page 56 of the 2010 Wells Fargo annual report below. You can navigate through the pages in the report by either clicking on the pages listed below, or by using the keyword search tool below to find specific information within the annual report.-
 1
1 -
2
-
3
-
4
-
5
-
6
-
7
-
8
-
9
-
10
-
11
-
12
-
13
-
14
-
15
-
16
-
17
-
18
-
19
-
20
-
21
-
22
-
23
-
24
-
25
-
26
-
27
-
28
-
29
-
30
-
31
-
32
-
33
-
34
-
35
-
36
-
37
-
38
-
39
-
40
-
41
-
42
-
43
-
44
-
45
-
 46
46 -
 47
47 -
 48
48 -
 49
49 -
 50
50 -
 51
51 -
 52
52 -
 53
53 -
 54
54 -
 55
55 -
 56
56 -
 57
57 -
 58
58 -
 59
59 -
 60
60 -
 61
61 -
 62
62 -
 63
63 -
 64
64 -
 65
65 -
 66
66 -
67
-
68
-
69
-
70
-
71
-
72
-
73
-
74
-
75
-
76
-
77
-
78
-
79
-
80
-
81
-
82
-
83
-
84
-
85
-
86
-
87
-
88
-
89
-
90
-
91
-
92
-
93
-
94
-
95
-
96
-
97
-
98
-
99
-
100
-
101
-
102
-
103
-
104
-
105
-
106
-
107
-
108
-
109
-
110
-
111
-
112
-
113
-
114
-
115
-
116
-
117
-
118
-
119
-
120
-
121
-
122
-
123
-
124
-
125
-
126
-
127
-
128
-
129
-
130
-
131
-
132
-
133
-
134
-
135
-
136
-
137
-
138
-
139
-
140
-
141
-
142
-
143
-
144
-
145
-
146
-
147
-
148
-
149
-
150
-
151
-
152
-
153
-
154
-
155
-
156
-
157
-
158
-
159
-
160
-
161
-
162
-
163
-
164
-
165
-
166
-
167
-
168
-
169
-
170
-
171
-
172
-
173
-
174
-
175
-
176
-
177
-
178
-
179
-
180
-
181
-
182
-
183
-
184
-
185
-
186
-
187
-
188
-
189
-
190
-
191
-
192
-
193
-
194
-
195
-
196
-
197
-
198
-
199
-
200
-
201
-
202
-
203
-
204
-
205
-
206
-
207
-
208
-
209
-
210
-
211
-
212
-
213
-
214
-
215
-
216
-
217
-
218
-
219
-
220
-
221
-
222
-
223
-
224
-
225
-
226
-
227
-
228
-
229
-
230
-
231
-
232
 |
 |

All financial institutions must manage and control a variety of
business risks that can significantly affect their financial
performance. Key among those are credit, asset/liability and
market risk.
Risk Management
Credit Risk Management
Our credit risk management process is governed centrally, but
provides for decentralized management and accountability by
our lines of business. Our overall credit process includes
comprehensive credit policies, judgmental or statistical credit
underwriting, frequent and detailed risk measurement and
modeling, extensive credit training programs, and a continual
loan review and audit process. In addition, banking regulatory
examiners review and perform detailed tests of our credit
underwriting, loan administration and allowance processes.
A key to our credit risk management is adhering to a well
controlled underwriting process, which we believe is
appropriate for the needs of our customers as well as investors
who purchase the loans or securities collateralized by the loans.
We approve applications and make loans only if we believe the
customer has the ability to repay the loan or line of credit
according to all its terms. Our underwriting of loans
collateralized by residential real property includes appraisals or
automated valuation models (AVMs) to support property
values. AVMs are computer-based tools used to estimate the
market value of homes. AVMs are a lower-cost alternative to
appraisals and support valuations of large numbers of
properties in a short period of time. AVMs estimate property
values based on processing large volumes of market data
including market comparables and price trends for local
market areas. The primary risk associated with the use of
AVMs is that the value of an individual property may vary
significantly from the average for the market area. We have
processes to periodically validate AVMs and specific risk
management guidelines addressing the circumstances when
AVMs may be used. Generally AVMs are used in underwriting
to support property values on loan originations only where the
loan amount is under $250,000. For underwriting residential
property loans of $250,000 or more, we require property
visitation appraisals by qualified independent appraisers.
We continually evaluate and modify our credit policies to
address appropriate levels of risk. Accordingly, from time to
time, we designate certain portfolios and loan products as non-
strategic or high risk to limit or cease their continued
origination as we actively work to limit losses and reduce our
exposures.
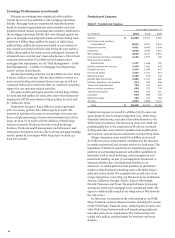
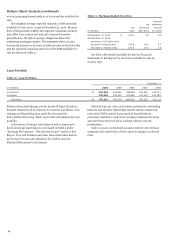
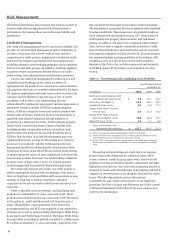
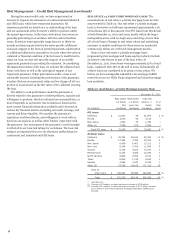
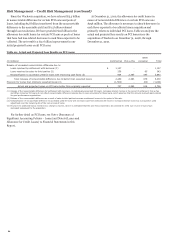
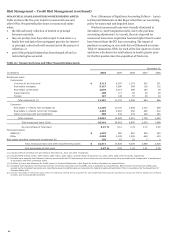
Table 17 identifies our non-strategic and liquidating loan
portfolios as of December 31, 2010, 2009 and 2008. These
portfolios have decreased 32% since the merger with Wachovia
at December 31, 2008, and decreased 19% from the end of
2009. The portfolios consist primarily of the Pick-a-Pay
mortgages portfolio and PCI loans acquired in our acquisition
of Wachovia as well as some portfolios from legacy Wells Fargo
home equity and Wells Fargo Financial. The legacy Wells Fargo
Financial debt consolidation portfolio included $1.2 billion and
$1.6 billion at December 31, 2010 and 2009, respectively, that
was considered prime based on secondary market standards.
The remainder is non-prime but was originated with standards
to reduce credit risk. These loans were originated through our
retail channel with documented income, LTV limits based on
credit quality and property characteristics, and risk-based
pricing. In addition, the loans were originated without teaser
rates, interest-only or negative amortization features. Credit
losses in the portfolio have increased in the current economic
environment compared with historical levels, but performance
has remained similar to prime portfolios in the industry with
overall loss rates of 4.15% in 2010 on the entire portfolio.
Analysis of the Pick-a-Pay and the commercial and industrial
and CRE domestic PCI portfolios is presented later in this
section.
Table 17: Non-Strategic and Liquidating Loan Portfolios
Outstanding balance
December 31,
(in billions)
2010
2009
2008
Commercial and industrial, CRE
and foreign PCI loans (1)(2)
$
7.9
13.0
18.7
Pick-a-Pay mortgage (1)
74.8
85.2
95.3
Liquidating home equity 6.9
8.4
10.3
Legacy Wells Fargo Financial
indirect auto 6.0
11.3
18.2
Legacy Wells Fargo Financial
debt consolidation (2)(3) 19.0
22.4
25.3
Other PCI loans (1)(2) 1.1
1.7
2.5
Total non-strategic and
liquidating loan portfolios $ 115.7
142.0
170.3
(1)
Net of purchase accounting adjustments related to PCI loans.
(2) These portfolios were designated as non-strategic and liquidating in 2010.
Prior periods have been adjusted to reflect this change.
(3) In July 2010, we announced the restructuring of our Wells Fargo Financial
division and the exiting of the origination of non-prime portfolio mortgage
loans.
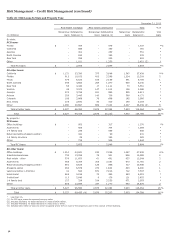
Measuring and monitoring our credit risk is an ongoing
process that tracks delinquencies, collateral values, FICO
scores, economic trends by geographic areas, loan-level risk
grading for certain portfolios (typically commercial) and other
indications of credit risk. Our credit risk monitoring process is
designed to enable early identification of developing risk and to
support our determination of an adequate allowance for credit
losses. The following analysis reviews the relevant
concentrations and certain credit metrics of our significant
portfolios. See Note 6 (Loans and Allowance for Credit Losses)
to Financial Statements in this Report for more analysis and
credit metric information.
54