Wells Fargo 2010 Annual Report Download - page 75
Download and view the complete annual report
Please find page 75 of the 2010 Wells Fargo annual report below. You can navigate through the pages in the report by either clicking on the pages listed below, or by using the keyword search tool below to find specific information within the annual report.-
 1
1 -
2
-
3
-
4
-
5
-
6
-
7
-
8
-
9
-
10
-
11
-
12
-
13
-
14
-
15
-
16
-
17
-
18
-
19
-
20
-
21
-
22
-
23
-
24
-
25
-
26
-
27
-
28
-
29
-
30
-
31
-
32
-
33
-
34
-
35
-
36
-
37
-
38
-
39
-
40
-
41
-
42
-
43
-
44
-
45
-
46
-
47
-
48
-
49
-
50
-
51
-
52
-
53
-
54
-
55
-
56
-
57
-
58
-
59
-
60
-
61
-
62
-
63
-
64
-
 65
65 -
 66
66 -
 67
67 -
 68
68 -
 69
69 -
 70
70 -
 71
71 -
 72
72 -
 73
73 -
 74
74 -
 75
75 -
 76
76 -
 77
77 -
 78
78 -
 79
79 -
 80
80 -
 81
81 -
 82
82 -
 83
83 -
 84
84 -
 85
85 -
86
-
87
-
88
-
89
-
90
-
91
-
92
-
93
-
94
-
95
-
96
-
97
-
98
-
99
-
100
-
101
-
102
-
103
-
104
-
105
-
106
-
107
-
108
-
109
-
110
-
111
-
112
-
113
-
114
-
115
-
116
-
117
-
118
-
119
-
120
-
121
-
122
-
123
-
124
-
125
-
126
-
127
-
128
-
129
-
130
-
131
-
132
-
133
-
134
-
135
-
136
-
137
-
138
-
139
-
140
-
141
-
142
-
143
-
144
-
145
-
146
-
147
-
148
-
149
-
150
-
151
-
152
-
153
-
154
-
155
-
156
-
157
-
158
-
159
-
160
-
161
-
162
-
163
-
164
-
165
-
166
-
167
-
168
-
169
-
170
-
171
-
172
-
173
-
174
-
175
-
176
-
177
-
178
-
179
-
180
-
181
-
182
-
183
-
184
-
185
-
186
-
187
-
188
-
189
-
190
-
191
-
192
-
193
-
194
-
195
-
196
-
197
-
198
-
199
-
200
-
201
-
202
-
203
-
204
-
205
-
206
-
207
-
208
-
209
-
210
-
211
-
212
-
213
-
214
-
215
-
216
-
217
-
218
-
219
-
220
-
221
-
222
-
223
-
224
-
225
-
226
-
227
-
228
-
229
-
230
-
231
-
232
 |
 |

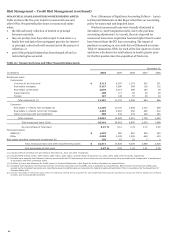
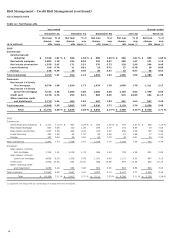
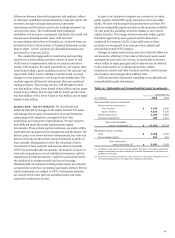
Table 33: Unresolved Repurchase Demands and Mortgage Insurance Recissions
Government
Mortgage insurance
sponsored entities (1)
Private
recissions with no demand (2)
Total
Number of
Original loan
Number of
Original loan
Number of
Original loan
Number of
Original loan
($ in millions) loans
balance (3)
loans
balance (3)
loans
balance (3)
loans
balance (3)
2010
December 31 6,501
$
1,467
2,899
$
680
3,248
$
801
12,648
$
2,948
September 30 9,887
2,212
3,605
882
3,035
748
16,527
3,842
June 30 12,536
2,840
3,160
707
2,979
760
18,675
4,307
March 31 10,804
2,499
2,320
519
2,843
737
15,967
3,755
December 31, 2009 8,354
1,911
2,929
886
2,965
859
14,248
3,656
(1)
Includes repurchase demands on 1,495 loans totaling $291 million and 1,536 loans totaling $322 million at December 31, 2010, and December 31, 2009, respectively,
received from investors on mortgage servicing rights acquired from other originators. We have the right of recourse against the seller for these repurchase demands and
would incur a loss only for counterparty risk associated with the seller.
(2) As part of our representations and warranties in our loan sales contracts, we represent that certain loans have mortgage insurance. To the extent the mortgage insurance is
rescinded by the mortgage insurer, the lack of insurance may result in a repurchase demand from an investor.
(3) While original loan balance related to these demands is presented above, the establishment of the repurchase reserve is based on a combination of factors, such as our
appeals success rates, reimbursement by correspondent and other third party originators, and projected loss severity, which is driven by the difference between the current
loan balance and the estimated collateral value less costs to sell the property.
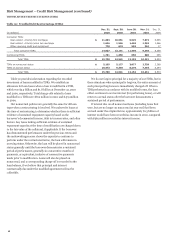
The level of repurchase demands outstanding at
December 31, 2010, was down from a year ago in both number of
outstanding loans and in total dollar balances as we continued to
work through the demands. Customary with industry practice,
we have the right of recourse against correspondent lenders with
respect to representations and warranties. Of the repurchase
demands presented in Table 33, approximately 20% relate to
loans purchased from correspondent lenders. Due primarily to
the financial difficulties of some correspondent lenders, we
typically recover on average approximately 50% of losses from
these lenders. Historical recovery rates as well as projected
lender performance are incorporated in the establishment of our
mortgage repurchase liability.
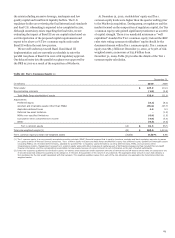
Our liability for repurchases, included in “Accrued expenses
and other liabilities” in our consolidated financial statements,
was $1.3 billion and $1.0 billion at December 31, 2010 and 2009,
respectively. In 2010, $1.6 billion of additions to the liability
were recorded, which reduced net gains on mortgage loan
origination/sales activities. Our additions to the repurchase
liability in 2010 reflect updated assumptions about the losses we
expect on repurchases and future demands, particularly on the
2006-2008 vintages.
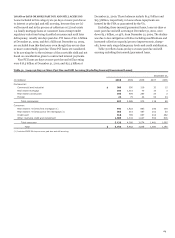
We believe we have a high quality residential mortgage loan
servicing portfolio. Of the $1.8 trillion in the residential
mortgage loan servicing portfolio at December 31, 2010, 92%
was current, less than 2% was subprime at origination, and
approximately 1% was home equity securitizations. Our
combined delinquency and foreclosure rate on this portfolio was
8.02% at December 31, 2010, compared with 8.96% at
December 31, 2009. In this portfolio 7% are private
securitizations where we originated the loan and therefore have
some repurchase risk; 58% of these loans are from 2005 vintages
or earlier (weighted average age of 63 months); 81% were prime
at origination; and approximately 70% are jumbo loans. The
weighted-average LTV as of December 31, 2010, was 72%. In
addition, the highest risk segment of these private securitizations
are the subprime loans originated in 2006 and 2007. These
subprime loans have seller representations and warranties and
currently have LTVs close to or exceeding 100%, and represent
8% of the 7% private securitization portion of the residential
mortgage servicing portfolio. We had only $114 million of
repurchases related to private securitizations in 2010. Of the
servicing portfolio, 4% is non-agency acquired servicing and 3%
is private whole loan sales. We did not underwrite and securitize
the non-agency acquired servicing and therefore we have no
obligation on that portion of our servicing portfolio to the
investor for any repurchase demands arising from origination
practices.
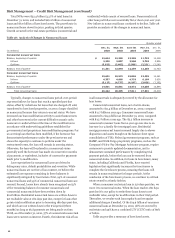
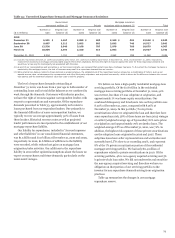
Table 34 summarizes the changes in our mortgage
repurchase reserve.
73