Wells Fargo 2010 Annual Report Download - page 208
Download and view the complete annual report
Please find page 208 of the 2010 Wells Fargo annual report below. You can navigate through the pages in the report by either clicking on the pages listed below, or by using the keyword search tool below to find specific information within the annual report.-
 1
1 -
2
-
3
-
4
-
5
-
6
-
7
-
8
-
9
-
10
-
11
-
12
-
13
-
14
-
15
-
16
-
17
-
18
-
19
-
20
-
21
-
22
-
23
-
24
-
25
-
26
-
27
-
28
-
29
-
30
-
31
-
32
-
33
-
34
-
35
-
36
-
37
-
38
-
39
-
40
-
41
-
42
-
43
-
44
-
45
-
46
-
47
-
48
-
49
-
50
-
51
-
52
-
53
-
54
-
55
-
56
-
57
-
58
-
59
-
60
-
61
-
62
-
63
-
64
-
65
-
66
-
67
-
68
-
69
-
70
-
71
-
72
-
73
-
74
-
75
-
76
-
77
-
78
-
79
-
80
-
81
-
82
-
83
-
84
-
85
-
86
-
87
-
88
-
89
-
90
-
91
-
92
-
93
-
94
-
95
-
96
-
97
-
98
-
99
-
100
-
101
-
102
-
103
-
104
-
105
-
106
-
107
-
108
-
109
-
110
-
111
-
112
-
113
-
114
-
115
-
116
-
117
-
118
-
119
-
120
-
121
-
122
-
123
-
124
-
125
-
126
-
127
-
128
-
129
-
130
-
131
-
132
-
133
-
134
-
135
-
136
-
137
-
138
-
139
-
140
-
141
-
142
-
143
-
144
-
145
-
146
-
147
-
148
-
149
-
150
-
151
-
152
-
153
-
154
-
155
-
156
-
157
-
158
-
159
-
160
-
161
-
162
-
163
-
164
-
165
-
166
-
167
-
168
-
169
-
170
-
171
-
172
-
173
-
174
-
175
-
176
-
177
-
178
-
179
-
180
-
181
-
182
-
183
-
184
-
185
-
186
-
187
-
188
-
189
-
190
-
191
-
192
-
193
-
194
-
195
-
196
-
197
-
 198
198 -
 199
199 -
 200
200 -
 201
201 -
 202
202 -
 203
203 -
 204
204 -
 205
205 -
 206
206 -
 207
207 -
 208
208 -
 209
209 -
 210
210 -
 211
211 -
 212
212 -
 213
213 -
 214
214 -
 215
215 -
 216
216 -
 217
217 -
 218
218 -
219
-
220
-
221
-
222
-
223
-
224
-
225
-
226
-
227
-
228
-
229
-
230
-
231
-
232
 |
 |

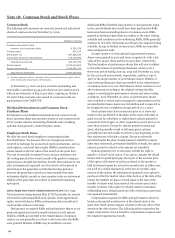
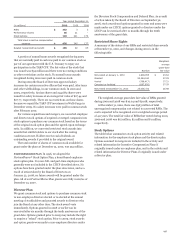
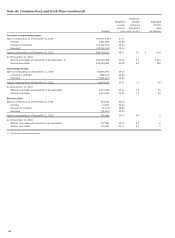
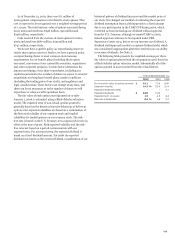
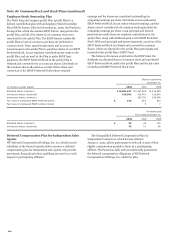
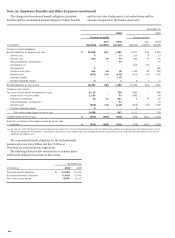
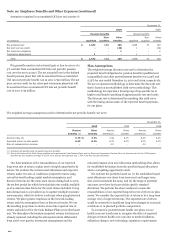
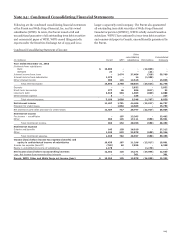
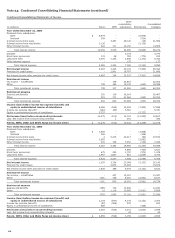
Note 19: Employee Benefits and Other Expenses (continued)
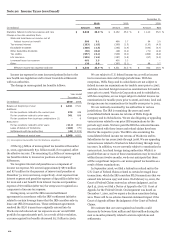
Fair Value of Plan Assets
The following table presents the balances of pension plan assets
and other benefit plan assets measured at fair value. Other
benefit plan assets include assets held in a 401(h) trust, which
are invested using the same asset allocation targets as the Cash
Balance Plan, and assets held in a VEBA trust. See Note 16 for
fair value hierarchy level definitions.
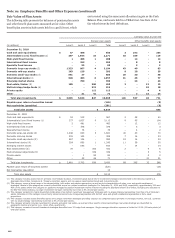
Carrying value at year end
Pension plan assets
Other benefits plan assets
(in millions)
Level 1
Level 2
Level 3
Total
Level 1
Level 2
Level 3
Total
December 31, 2010
Cash and cash equivalents $ 47
488
-
535
2
252
-
254
Intermediate (core) fixed income (1) 297
1,964
10
2,271
10
109
-
119
High-yield fixed income 1
406
1
408
-
14
-
14
International fixed income -
263
-
263
-
8
-
8
Specialty fixed income -
95
-
95
-
3
-
3
Domestic large-cap stocks (2) 1,323
867
4
2,194
43
40
-
83
Domestic mid-cap stocks 263
129
-
392
9
20
-
29
Domestic small-cap stocks (3) 851
37
-
888
28
20
-
48
International stocks (4) 948
403
6
1,357
31
46
-
77
Emerging market stocks -
700
-
700
-
23
-
23
Real estate/timber (5) 105
-
360
465
3
-
12
15
Multi-strategy hedge funds (6) -
-
313
313
-
-
10
10
Private equity -
-
112
112
-
-
4
4
Other -
31
41
72
-
2
22
24
Total plan investments $ 3,835
5,383
847
10,065
126
537
48
711
Payable upon return of securities loaned (145)
(5)
Net receivables (payables) (281)
(9)
Total plan assets $ 9,639
697
December 31, 2009
Cash and cash equivalents $ 52
515
-
567
2
38
-
40
Intermediate (core) fixed income (1) 277
1,827
9
2,113
9
95
-
104
High-yield fixed income 2
481
-
483
-
12
-
12
International fixed income -
376
-
376
-
3
-
3
Specialty fixed income -
76
-
76
-
2
-
2
Domestic large-cap stocks (2) 1,046
630
5
1,681
40
30
-
70
Domestic mid-cap stocks 205
103
-
308
7
16
-
23
Domestic small-cap stocks (3) 867
126
-
993
18
16
-
34
International stocks (4) 354
890
1
1,245
11
39
-
50
Emerging market stocks -
653
-
653
-
14
-
14
Real estate/timber (5) 78
-
353
431
2
-
4
6
Multi-strategy hedge funds (6) -
-
339
339
-
-
5
5
Private equity -
1
83
84
-
-
2
2
Other -
25
46
71
-
-
21
21
Total plan investments $ 2,881
5,703
836
9,420
89
265
32
386
Payable upon return of securities loaned (320)
(10)
Net receivables (payables) 12
-
Total plan assets $ 9,112
376
(1) This category includes assets that are primarily intermediate duration, investment grade bonds held in investment strategies benchmarked to the Barclays Capital U.S.
Aggregate Bond Index. Includes U.S. Treasury securities, agency and non-agency asset-backed bonds and corporate bonds.
(2) This category covers a broad range of investment styles, both active and passive approaches, as well as style characteristics of value, core and growth emphasized
strategies. Assets in this category are currently diversified across ten unique investment strategies. For December 31, 2010 and 2009, respectively, approximately 33% and
40% of the assets within this category are passively managed to popular mainstream market indexes including the Standard & Poor's 500 Index; excluding the allocation to
the S&P 500 Index strategy, no single investment manager represents more than 2.5% of total plan assets.
(3) This category consists of a highly diversified combination of six distinct investment management strategies with no single strategy representing more than 2% of total plan
assets. Allocations in this category are primarily spread across actively managed approaches with distinct value and growth emphasized approaches in fairly equal
proportions.
(4) This category includes assets diversified across nine unique investment strategies providing exposure to companies based primarily in developed market, non-U.S. countries
with no single strategy representing more than 2.5% of total plan assets.
(5) This category primarily includes investments in private and public real estate, as well as timber specific limited partnerships; real estate holdings are diversified by
geographic location and sector (e.g., retail, office, apartments).
(6) This category consists of several investment strategies diversified over 30 hedge fund managers. Single manager allocation exposure is limited to 0.15% (15 basis points) of
total plan assets.
206