Wells Fargo 2010 Annual Report Download - page 189
Download and view the complete annual report
Please find page 189 of the 2010 Wells Fargo annual report below. You can navigate through the pages in the report by either clicking on the pages listed below, or by using the keyword search tool below to find specific information within the annual report.-
 1
1 -
2
-
3
-
4
-
5
-
6
-
7
-
8
-
9
-
10
-
11
-
12
-
13
-
14
-
15
-
16
-
17
-
18
-
19
-
20
-
21
-
22
-
23
-
24
-
25
-
26
-
27
-
28
-
29
-
30
-
31
-
32
-
33
-
34
-
35
-
36
-
37
-
38
-
39
-
40
-
41
-
42
-
43
-
44
-
45
-
46
-
47
-
48
-
49
-
50
-
51
-
52
-
53
-
54
-
55
-
56
-
57
-
58
-
59
-
60
-
61
-
62
-
63
-
64
-
65
-
66
-
67
-
68
-
69
-
70
-
71
-
72
-
73
-
74
-
75
-
76
-
77
-
78
-
79
-
80
-
81
-
82
-
83
-
84
-
85
-
86
-
87
-
88
-
89
-
90
-
91
-
92
-
93
-
94
-
95
-
96
-
97
-
98
-
99
-
100
-
101
-
102
-
103
-
104
-
105
-
106
-
107
-
108
-
109
-
110
-
111
-
112
-
113
-
114
-
115
-
116
-
117
-
118
-
119
-
120
-
121
-
122
-
123
-
124
-
125
-
126
-
127
-
128
-
129
-
130
-
131
-
132
-
133
-
134
-
135
-
136
-
137
-
138
-
139
-
140
-
141
-
142
-
143
-
144
-
145
-
146
-
147
-
148
-
149
-
150
-
151
-
152
-
153
-
154
-
155
-
156
-
157
-
158
-
159
-
160
-
161
-
162
-
163
-
164
-
165
-
166
-
167
-
168
-
169
-
170
-
171
-
172
-
173
-
174
-
175
-
176
-
177
-
178
-
 179
179 -
 180
180 -
 181
181 -
 182
182 -
 183
183 -
 184
184 -
 185
185 -
 186
186 -
 187
187 -
 188
188 -
 189
189 -
 190
190 -
 191
191 -
 192
192 -
 193
193 -
 194
194 -
 195
195 -
 196
196 -
 197
197 -
 198
198 -
 199
199 -
200
-
201
-
202
-
203
-
204
-
205
-
206
-
207
-
208
-
209
-
210
-
211
-
212
-
213
-
214
-
215
-
216
-
217
-
218
-
219
-
220
-
221
-
222
-
223
-
224
-
225
-
226
-
227
-
228
-
229
-
230
-
231
-
232
 |
 |

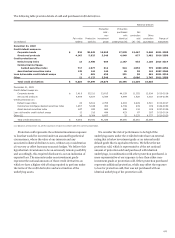
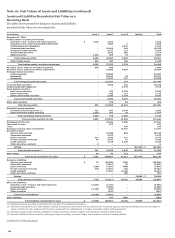
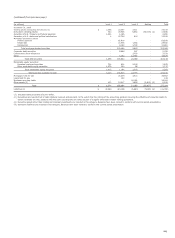
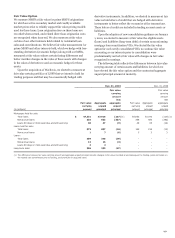
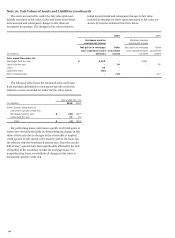
(continued from previous page)
Net unrealized
Total net gains
Purchases,
gains (losses)
(losses) included in
sales,
Net
included in net
Other
issuances
transfers
income related
Balance,
compre-
and
into and/
Balance,
to assets and
beginning
Net
hensive
settlements,
or out of
end
liabilities held
(in millions)
of year
income
income
net
Level 3
of year
at period end (1)
Year ended December 31, 2009
Trading assets (excluding derivatives) $ 3,495
202
2
(1,749)
361
2,311
276
(2)
Securities available for sale:
Securities of U.S. states and political subdivisions 903
23
-
25
(133)
818
(8)
Mortgage-backed securities:
Federal agencies 4
-
-
-
(4)
-
-
Residential 3,510
(74)
1,092
(759)
(2,685)
1,084
(227)
Commercial 286
(220)
894
41
798
1,799
(112)
Total mortgage-backed securities 3,800
(294)
1,986
(718)
(1,891)
2,883
(339)
Corporate debt securities 282
3
61
(7)
28
367
-
Collateralized debt obligations 2,083
125
577
623
317
3,725
(84)
Other 12,799
136
1,368
584
(2,300)
12,587
(94)
Total debt securities 19,867
(7)
3,992
507
(3,979)
20,380
(525)
(3)
Marketable equity securities:
Perpetual preferred securities 2,775
104
144
(723)
5
2,305
(1)
Other marketable equity securities 50
-
(2)
63
(23)
88
-
Total marketable equity securities 2,825
104
142
(660)
(18)
2,393
(1)
(4)
Total securities available for sale $ 22,692
97
4,134
(153)
(3,997)
22,773
(526)
Mortgages held for sale $ 4,718
(96)
-
(921)
(178)
3,523
(109)
(5)
Mortgage servicing rights 14,714
(4,970)
-
6,260
-
16,004
(1,534)
(5)
Net derivative assets and liabilities 37
1,439
-
(2,291)
(17)
(832)
(799)
(6)
Other assets (excluding derivatives) 1,231
10
-
132
-
1,373
12
(2)
Liabilities (excluding derivatives)(7)
(16)
(11)
-
1
(10)
(36)
14
Year ended December 31, 2008
Trading assets (excluding derivatives) $ 418
(120)
-
3,197
-
3,495
(23)
(2)
Securities available for sale:
Securities of U.S. states and political subdivisions 168
-
(81)
538
278
903
-
Mortgage-backed securities:
Federal agencies -
-
-
-
4
4
-
Residential 486
(180)
(302)
3,307
199
3,510
(150)
Commercial -
(10)
(210)
163
343
286
-
Total mortgage-backed securities 486
(190)
(512)
3,470
546
3,800
(150)
Corporate debt securities -
-
(44)
326
-
282
-
Collateralized debt obligations -
(152)
(280)
1,679
836
2,083
-
Other 4,726
(15)
(572)
8,379
281
12,799
-
Total debt securities 5,380
(357)
(1,489)
14,392
1,941
19,867
(150)
(3)
Marketable equity securities:
Perpetual preferred securities -
-
-
2,775
-
2,775
-
Other marketable equity securities 1
-
-
49
-
50
-
Total marketable equity securities 1
-
-
2,824
-
2,825
-
(4)
Total securities available for sale $ 5,381
(357)
(1,489)
17,216
1,941
22,692
(150)
Mortgages held for sale $ 146
(280)
-
561
4,291
4,718
(268)
(5)
Mortgage servicing rights 16,763
(5,927)
-
3,878
-
14,714
(333)
(5)
Net derivative assets and liabilities 6
(275)
1
303
2
37
93
(6)
Other assets (excluding derivatives) -
-
-
1,231
-
1,231
-
(2)
Liabilities (excluding derivatives) (7)
(27)
6
-
5
-
(16)
6
(1) Represents only net gains (losses) that are due to changes in economic conditions and management’s estimates of fair value and excludes changes due to the
collection/realization of cash flows over time.
(2) Included in other noninterest income in the income statement.
(3) Included in debt securities available for sale in the income statement.
(4) Included in equity investments in the income statement.
(5) Included in mortgage banking in the income statement.
(6) Included in mortgage banking, trading activities and other noninterest income in the income statement.
(7) Balances have been revised to conform with current period presentation.
187