Wells Fargo 2010 Annual Report Download - page 147
Download and view the complete annual report
Please find page 147 of the 2010 Wells Fargo annual report below. You can navigate through the pages in the report by either clicking on the pages listed below, or by using the keyword search tool below to find specific information within the annual report.-
 1
1 -
2
-
3
-
4
-
5
-
6
-
7
-
8
-
9
-
10
-
11
-
12
-
13
-
14
-
15
-
16
-
17
-
18
-
19
-
20
-
21
-
22
-
23
-
24
-
25
-
26
-
27
-
28
-
29
-
30
-
31
-
32
-
33
-
34
-
35
-
36
-
37
-
38
-
39
-
40
-
41
-
42
-
43
-
44
-
45
-
46
-
47
-
48
-
49
-
50
-
51
-
52
-
53
-
54
-
55
-
56
-
57
-
58
-
59
-
60
-
61
-
62
-
63
-
64
-
65
-
66
-
67
-
68
-
69
-
70
-
71
-
72
-
73
-
74
-
75
-
76
-
77
-
78
-
79
-
80
-
81
-
82
-
83
-
84
-
85
-
86
-
87
-
88
-
89
-
90
-
91
-
92
-
93
-
94
-
95
-
96
-
97
-
98
-
99
-
100
-
101
-
102
-
103
-
104
-
105
-
106
-
107
-
108
-
109
-
110
-
111
-
112
-
113
-
114
-
115
-
116
-
117
-
118
-
119
-
120
-
121
-
122
-
123
-
124
-
125
-
126
-
127
-
128
-
129
-
130
-
131
-
132
-
133
-
134
-
135
-
136
-
 137
137 -
 138
138 -
 139
139 -
 140
140 -
 141
141 -
 142
142 -
 143
143 -
 144
144 -
 145
145 -
 146
146 -
 147
147 -
 148
148 -
 149
149 -
 150
150 -
 151
151 -
 152
152 -
 153
153 -
 154
154 -
 155
155 -
 156
156 -
 157
157 -
158
-
159
-
160
-
161
-
162
-
163
-
164
-
165
-
166
-
167
-
168
-
169
-
170
-
171
-
172
-
173
-
174
-
175
-
176
-
177
-
178
-
179
-
180
-
181
-
182
-
183
-
184
-
185
-
186
-
187
-
188
-
189
-
190
-
191
-
192
-
193
-
194
-
195
-
196
-
197
-
198
-
199
-
200
-
201
-
202
-
203
-
204
-
205
-
206
-
207
-
208
-
209
-
210
-
211
-
212
-
213
-
214
-
215
-
216
-
217
-
218
-
219
-
220
-
221
-
222
-
223
-
224
-
225
-
226
-
227
-
228
-
229
-
230
-
231
-
232
 |
 |

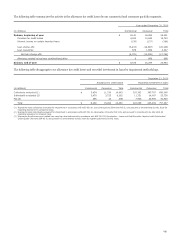
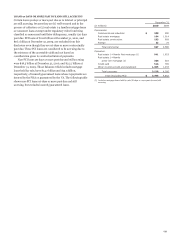
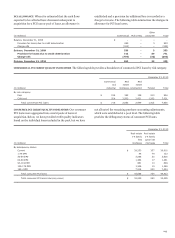
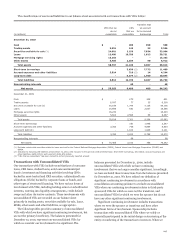
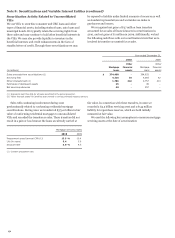
Note 7: Premises, Equipment, Lease Commitments and Other Assets
December 31,
(in millions) 2010
2009
Land $ 1,825
2,140
Buildings 7,440
8,143
Furniture and equipment 6,689
6,232
Leasehold improvements 1,683
1,381
Premises and equipment leased
under capital leases 148
152
Total premises and equipment 17,785
18,048
Less: Accumulated depreciation
and amortization 8,141
7,312
Net book value,
premises and equipment $ 9,644
10,736
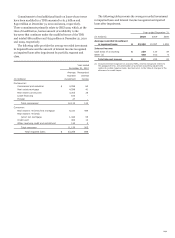
Depreciation and amortization expense for premises and
equipment was $1.5 billion, $1.3 billion and $861 million in
2010, 2009 and 2008, respectively.
Dispositions of premises and equipment, included in
noninterest expense, resulted in net losses of $115 million in
2010, net losses of $22 million in 2009 and net gains of
$3 million in 2008.
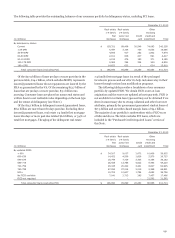
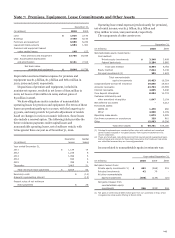
We have obligations under a number of noncancelable
operating leases for premises and equipment. The terms of these
leases are predominantly up to 15 years, with the longest up to
95 years, and many provide for periodic adjustment of rentals
based on changes in various economic indicators. Some leases
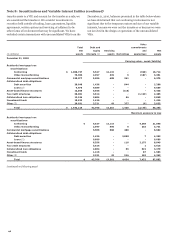
also include a renewal option. The following table provides the
future minimum payments under capital leases and
noncancelable operating leases, net of sublease rentals, with
terms greater than one year as of December 31, 2010.
Operating
Capital
(in millions)
leases
leases
Year ended December 31,
2011 $ 1,134
14
2012
1,235
5
2013
1,099
5
2014
944
4
2015
788
3
Thereafter
3,405
21
Total minimum lease payments $ 8,605
52
Executory costs
$ (14)
Amounts representing interest
(12)
Present value of net minimum
lease payments
$ 26
Operating lease rental expense (predominantly for premises),
net of rental income, was $1.3 billion, $1.4 billion and
$709 million in 2010, 2009 and 2008, respectively.
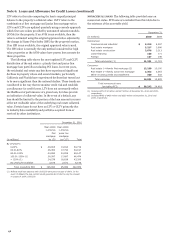
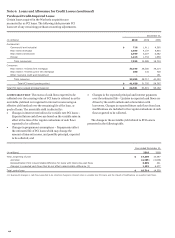
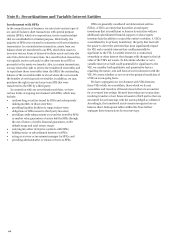
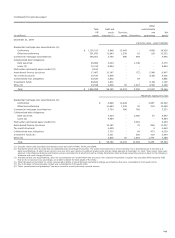
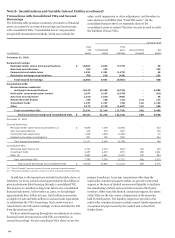
The components of other assets were:
December 31,
(in millions) 2010
2009
Nonmarketable equity investments:
Cost method:
Private equity investments $ 3,240
3,808
Federal bank stock 5,254
5,985
Total cost method 8,494
9,793
Equity method 7,624
5,138
Principal investments (1) 305
1,423
Total nonmarketable
equity investments 16,423
16,354
Corporate/bank-owned life insurance 19,845
19,515
Accounts receivable 23,763
20,565
Interest receivable 4,895
5,946
Core deposit intangibles 8,904
10,774
Customer relationship and
other amortized intangibles 1,847
2,154
Net deferred tax assets -
3,212
Foreclosed assets:
GNMA (2) 1,479
960
Other 4,530
2,199
Operating lease assets 1,873
2,395
Due from customers on acceptances 229
810
Other 15,993
19,296
Total other assets $ 99,781
104,180
(1) Principal investments are recorded at fair value with realized and unrealized
gains (losses) included in net gains (losses) from equity investments in the
income statement.
(2) These are foreclosed real estate securing FHA insured and VA guaranteed loans.
Both principal and interest for these loans secured by the foreclosed real estate
are collectible because they are insured/guaranteed.
Income related to nonmarketable equity investments was:
Year ended December 31,
(in millions) 2010
2009
2008
Net gains (losses) from:
Private equity investments (1) $ 492
(368)
251
Principal investments 42
79
-
All other nonmarketable
equity investments (188)
(234)
(10)
Net gains (losses) from
nonmarketable equity
investments $ 346
(523)
241
(1) Net gains in 2008 include $334 million gain from our ownership in Visa, which
completed its initial public offering in March 2008.
145