Wells Fargo 2010 Annual Report Download - page 175
Download and view the complete annual report
Please find page 175 of the 2010 Wells Fargo annual report below. You can navigate through the pages in the report by either clicking on the pages listed below, or by using the keyword search tool below to find specific information within the annual report.-
 1
1 -
2
-
3
-
4
-
5
-
6
-
7
-
8
-
9
-
10
-
11
-
12
-
13
-
14
-
15
-
16
-
17
-
18
-
19
-
20
-
21
-
22
-
23
-
24
-
25
-
26
-
27
-
28
-
29
-
30
-
31
-
32
-
33
-
34
-
35
-
36
-
37
-
38
-
39
-
40
-
41
-
42
-
43
-
44
-
45
-
46
-
47
-
48
-
49
-
50
-
51
-
52
-
53
-
54
-
55
-
56
-
57
-
58
-
59
-
60
-
61
-
62
-
63
-
64
-
65
-
66
-
67
-
68
-
69
-
70
-
71
-
72
-
73
-
74
-
75
-
76
-
77
-
78
-
79
-
80
-
81
-
82
-
83
-
84
-
85
-
86
-
87
-
88
-
89
-
90
-
91
-
92
-
93
-
94
-
95
-
96
-
97
-
98
-
99
-
100
-
101
-
102
-
103
-
104
-
105
-
106
-
107
-
108
-
109
-
110
-
111
-
112
-
113
-
114
-
115
-
116
-
117
-
118
-
119
-
120
-
121
-
122
-
123
-
124
-
125
-
126
-
127
-
128
-
129
-
130
-
131
-
132
-
133
-
134
-
135
-
136
-
137
-
138
-
139
-
140
-
141
-
142
-
143
-
144
-
145
-
146
-
147
-
148
-
149
-
150
-
151
-
152
-
153
-
154
-
155
-
156
-
157
-
158
-
159
-
160
-
161
-
162
-
163
-
164
-
 165
165 -
 166
166 -
 167
167 -
 168
168 -
 169
169 -
 170
170 -
 171
171 -
 172
172 -
 173
173 -
 174
174 -
 175
175 -
 176
176 -
 177
177 -
 178
178 -
 179
179 -
 180
180 -
 181
181 -
 182
182 -
 183
183 -
 184
184 -
 185
185 -
186
-
187
-
188
-
189
-
190
-
191
-
192
-
193
-
194
-
195
-
196
-
197
-
198
-
199
-
200
-
201
-
202
-
203
-
204
-
205
-
206
-
207
-
208
-
209
-
210
-
211
-
212
-
213
-
214
-
215
-
216
-
217
-
218
-
219
-
220
-
221
-
222
-
223
-
224
-
225
-
226
-
227
-
228
-
229
-
230
-
231
-
232
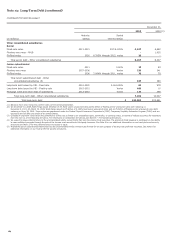
 |
 |
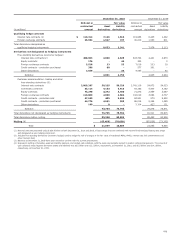
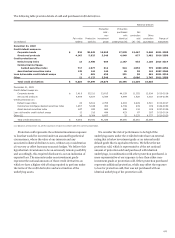
December 31, 2010
December 31, 2009
Notional or
Fair value
Notional or
Fair value
contractual
Asset
Liability
contractual
Asset
Liability
(in millions)
amount
derivatives
derivatives
amount
derivatives
derivatives
Qualifying hedge contracts
Interest rate contracts (1) $
110,314
7,126
1,614
119,966
6,425
1,302
Foreign exchange contracts
25,904
1,527
727
30,212
1,553
811
Total derivatives designated as
qualifying hedging instruments
8,653
2,341
7,978
2,113
Derivatives not designated as hedging instruments
Free-standing derivatives (economic hedges):
Interest rate contracts (2)
408,563
2,898
2,625
633,734
4,441
4,873
Equity contracts
176
-
46
300
-
2
Foreign exchange contracts
5,528
23
53
7,019
233
29
Credit contracts - protection purchased
396
80
-
577
261
-
Other derivatives
2,538
-
35
4,583
-
40
Subtotal
3,001
2,759
4,935
4,944
Customer accommodation, trading and other
free-standing derivatives (3):
Interest rate contracts
2,809,387
58,225
59,329
2,741,119
54,873
54,033
Commodity contracts
83,114
4,133
3,918
92,182
5,400
5,182
Equity contracts
73,278
3,272
3,450
71,572
2,459
3,067
Foreign exchange contracts
110,889
2,800
2,682
142,012
3,084
2,737
Credit contracts - protection sold
47,699
605
5,826
84,541
979
9,592
Credit contracts - protection purchased
44,776
4,661
588
86,014
9,354
1,089
Other derivatives
190
8
-
2,314
427
171
Subtotal
73,704
75,793
76,576
75,871
Total derivatives not designated as hedging instruments
76,705
78,552
81,511
80,815
Total derivatives before netting
85,358
80,893
89,489
82,928
Netting (4)
(63,469)
(70,009)
(65,926)
(73,303)
Total
$
21,889
10,884
23,563
9,625
(1) Notional amounts presented exclude $20.9 billion at both December 31, 2010 and 2009, of basis swaps that are combined with receive fixed-rate/pay floating-rate swaps
and designated as one hedging instrument.
(2) Includes free-standing derivatives (economic hedges) used to hedge the risk of changes in the fair value of residential MSRs, MHFS, interest rate lock commitments and
other interests held.
(3) Balances at December 31, 2009 have been revised to conform with the current presentation.
(4) Represents netting of derivative asset and liability balances, and related cash collateral, with the same counterparty subject to master netting arrangements. The amount of
cash collateral netted against derivative assets and liabilities was $5.5 billion and $12.1 billion, respectively, at December 31, 2010, and $5.3 billion and $14.1 billion,
respectively, at December 31, 2009.
173