Wells Fargo 2010 Annual Report Download - page 73
Download and view the complete annual report
Please find page 73 of the 2010 Wells Fargo annual report below. You can navigate through the pages in the report by either clicking on the pages listed below, or by using the keyword search tool below to find specific information within the annual report.-
 1
1 -
2
-
3
-
4
-
5
-
6
-
7
-
8
-
9
-
10
-
11
-
12
-
13
-
14
-
15
-
16
-
17
-
18
-
19
-
20
-
21
-
22
-
23
-
24
-
25
-
26
-
27
-
28
-
29
-
30
-
31
-
32
-
33
-
34
-
35
-
36
-
37
-
38
-
39
-
40
-
41
-
42
-
43
-
44
-
45
-
46
-
47
-
48
-
49
-
50
-
51
-
52
-
53
-
54
-
55
-
56
-
57
-
58
-
59
-
60
-
61
-
62
-
 63
63 -
 64
64 -
 65
65 -
 66
66 -
 67
67 -
 68
68 -
 69
69 -
 70
70 -
 71
71 -
 72
72 -
 73
73 -
 74
74 -
 75
75 -
 76
76 -
 77
77 -
 78
78 -
 79
79 -
 80
80 -
 81
81 -
 82
82 -
 83
83 -
84
-
85
-
86
-
87
-
88
-
89
-
90
-
91
-
92
-
93
-
94
-
95
-
96
-
97
-
98
-
99
-
100
-
101
-
102
-
103
-
104
-
105
-
106
-
107
-
108
-
109
-
110
-
111
-
112
-
113
-
114
-
115
-
116
-
117
-
118
-
119
-
120
-
121
-
122
-
123
-
124
-
125
-
126
-
127
-
128
-
129
-
130
-
131
-
132
-
133
-
134
-
135
-
136
-
137
-
138
-
139
-
140
-
141
-
142
-
143
-
144
-
145
-
146
-
147
-
148
-
149
-
150
-
151
-
152
-
153
-
154
-
155
-
156
-
157
-
158
-
159
-
160
-
161
-
162
-
163
-
164
-
165
-
166
-
167
-
168
-
169
-
170
-
171
-
172
-
173
-
174
-
175
-
176
-
177
-
178
-
179
-
180
-
181
-
182
-
183
-
184
-
185
-
186
-
187
-
188
-
189
-
190
-
191
-
192
-
193
-
194
-
195
-
196
-
197
-
198
-
199
-
200
-
201
-
202
-
203
-
204
-
205
-
206
-
207
-
208
-
209
-
210
-
211
-
212
-
213
-
214
-
215
-
216
-
217
-
218
-
219
-
220
-
221
-
222
-
223
-
224
-
225
-
226
-
227
-
228
-
229
-
230
-
231
-
232
 |
 |
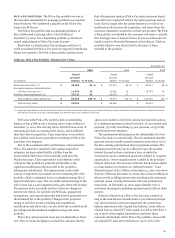
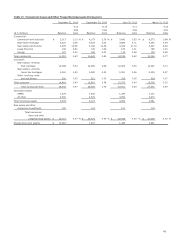
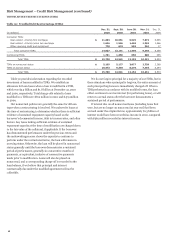
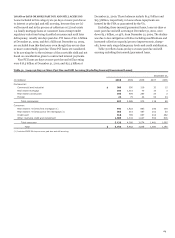
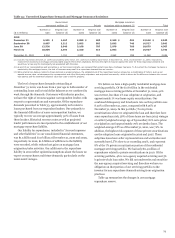
Table 32 presents net charge-offs for the four quarters and
full year of 2010 and 2009. Net charge-offs in 2010 were
$17.8 billion (2.30% of average total loans outstanding)
compared with $18.2 billion (2.21%) in 2009. Total net charge-
offs decreased in 2010 in part due to lower average loan balances
and as a result of modestly improving economic conditions,
aggressive loss mitigation activities aimed at working with our
customers through their financial challenges, and a depletion of
the pool of the most challenged vintages/relationships in the
portfolio. Total net charge-offs decreased each quarter
throughout the year from the peak loss level in fourth quarter of
2009. While loss levels remained elevated, the broad-based
improvement across the portfolio was an encouraging trend.
Net charge-offs in the 1-4 family first mortgage portfolio
totaled $4.4 billion in 2010. Our relatively high quality 1-4
family first mortgage portfolio continued to reflect relatively low
loss rates, although until housing prices fully stabilize, these
credit losses will continue to remain elevated.
Net charge-offs in the real estate 1-4 family junior lien
portfolio were $4.7 billion in 2010. Loss levels increased
throughout 2009 and peaked in the first quarter of 2010. Loss
levels will remain elevated, however, until conditions in the real
estate markets improve. More information about the Home
Equity portfolio, which includes substantially all of our real
estate 1-4 family junior lien mortgage loans, is available in
Table 25 in this Report and the related discussion.
Credit card charge-offs decreased $350 million to
$2.2 billion in 2010. Delinquency and loss levels improved in
2010 as the economy showed signs of stabilization.
Commercial and CRE net charge-offs were $4.8 billion in
2010 compared with $5.2 billion a year ago. Wholesale credit
results improved from 2009 as market liquidity and improving
market conditions helped stabilize performance results.
Increased lending activity in fourth quarter 2010 in the majority
of our commercial business lines further supported our belief of
a turn in the demand for credit.
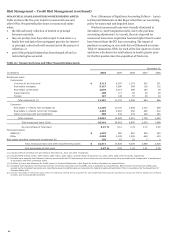
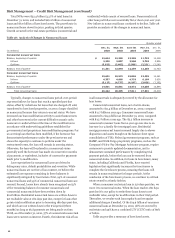
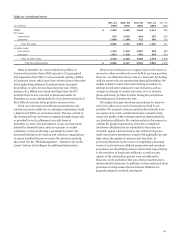
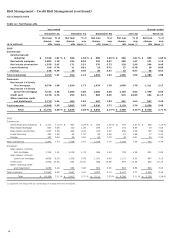
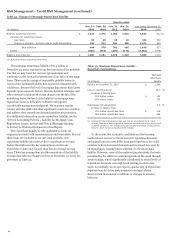
ALLOWANCE FOR CREDIT LOSSES The allowance for credit
losses, which consists of the allowance for loan losses and the
allowance for unfunded credit commitments, is management’s
estimate of credit losses inherent in the loan portfolio and
unfunded credit commitments at the balance sheet date,
excluding loans carried at fair value. The detail of the changes in
the allowance for credit losses by portfolio segment (including
charge-offs and recoveries by loan class) is in Note 6 (Loans and
Allowance for Credit Losses) to Financial Statements in this
Report.
We employ a disciplined process and methodology to
establish our allowance for credit losses each quarter. This
process takes into consideration many factors, including
historical and forecasted loss trends, loan-level credit quality
ratings and loan grade-specific loss factors. The process involves
subjective as well as complex judgments. In addition, we review
a variety of credit metrics and trends. However, these trends do
not solely determine the adequacy of the allowance as we use
several analytical tools in determining its adequacy. For
additional information on our allowance for credit losses, see the
“Critical Accounting Policies – Allowance for Credit Losses”
section and Note 6 (Loans and Allowance for Credit Losses) to
Financial Statements in this Report.
At December 31, 2010, the allowance for loan losses totaled
$23.0 billion (3.04% of total loans), compared with $24.5 billion
(3.13%), at December 31, 2009. The allowance for credit losses
was $23.5 billion (3.10% of total loans) at December 31, 2010,
and $25.0 billion (3.20%) at December 31, 2009. The allowance
for credit losses included $298 million and $333 million at
December 31, 2010 and 2009, respectively, related to PCI loans
acquired from Wachovia. The allowance for unfunded credit
commitments was $441 million and $515 million at
December 31, 2010 and 2009, respectively. In addition to the
allowance for credit losses there was $13.4 billion and
$22.9 billion of nonaccretable difference at December 31, 2010
and 2009, respectively, to absorb losses for PCI loans. For
additional information on PCI loans, see the “Risk Management
– Credit Risk Management – Purchased Credit-Impaired Loans”
section and Note 6 (Loans and Allowance for Credit Losses) to
Financial Statements in this Report.
The ratio of the allowance for credit losses to total
nonaccrual loans was 89% and 103% at December 31, 2010 and
2009, respectively. This ratio may fluctuate significantly
from period to period due to such factors as the mix of loan
types in the portfolio, borrower credit strength and the value and
marketability of collateral. Over half of nonaccrual loans were
home mortgages, auto and other consumer loans at
December 31, 2010.
The ratio of the allowance for loan losses to annual net
charge-offs was 130% and 135% at December 31, 2010 and 2009,
respectively. The $1.5 billion decline in the allowance for loan
losses in 2010 reflected lower loan balances and lower levels of
inherent credit loss in the portfolio compared with previous
year-end levels. When anticipated charge-offs are projected to
decline from current levels, this ratio will decrease. As more of
the portfolio experiences charge-offs, charge-off levels continue
to increase and the remaining portfolio is anticipated to consist
of higher quality vintage loans subjected to tightened
underwriting standards administered during the downturn in
the credit cycle. As charge-off levels peak, we anticipate coverage
levels will decrease until charge-off levels return to more
normalized levels. This ratio may fluctuate significantly from
period to period due to many factors, including general
economic conditions, customer credit strength and the
marketability of collateral.
71