Wells Fargo 2010 Annual Report Download - page 138
Download and view the complete annual report
Please find page 138 of the 2010 Wells Fargo annual report below. You can navigate through the pages in the report by either clicking on the pages listed below, or by using the keyword search tool below to find specific information within the annual report.-
 1
1 -
2
-
3
-
4
-
5
-
6
-
7
-
8
-
9
-
10
-
11
-
12
-
13
-
14
-
15
-
16
-
17
-
18
-
19
-
20
-
21
-
22
-
23
-
24
-
25
-
26
-
27
-
28
-
29
-
30
-
31
-
32
-
33
-
34
-
35
-
36
-
37
-
38
-
39
-
40
-
41
-
42
-
43
-
44
-
45
-
46
-
47
-
48
-
49
-
50
-
51
-
52
-
53
-
54
-
55
-
56
-
57
-
58
-
59
-
60
-
61
-
62
-
63
-
64
-
65
-
66
-
67
-
68
-
69
-
70
-
71
-
72
-
73
-
74
-
75
-
76
-
77
-
78
-
79
-
80
-
81
-
82
-
83
-
84
-
85
-
86
-
87
-
88
-
89
-
90
-
91
-
92
-
93
-
94
-
95
-
96
-
97
-
98
-
99
-
100
-
101
-
102
-
103
-
104
-
105
-
106
-
107
-
108
-
109
-
110
-
111
-
112
-
113
-
114
-
115
-
116
-
117
-
118
-
119
-
120
-
121
-
122
-
123
-
124
-
125
-
126
-
127
-
 128
128 -
 129
129 -
 130
130 -
 131
131 -
 132
132 -
 133
133 -
 134
134 -
 135
135 -
 136
136 -
 137
137 -
 138
138 -
 139
139 -
 140
140 -
 141
141 -
 142
142 -
 143
143 -
 144
144 -
 145
145 -
 146
146 -
 147
147 -
 148
148 -
149
-
150
-
151
-
152
-
153
-
154
-
155
-
156
-
157
-
158
-
159
-
160
-
161
-
162
-
163
-
164
-
165
-
166
-
167
-
168
-
169
-
170
-
171
-
172
-
173
-
174
-
175
-
176
-
177
-
178
-
179
-
180
-
181
-
182
-
183
-
184
-
185
-
186
-
187
-
188
-
189
-
190
-
191
-
192
-
193
-
194
-
195
-
196
-
197
-
198
-
199
-
200
-
201
-
202
-
203
-
204
-
205
-
206
-
207
-
208
-
209
-
210
-
211
-
212
-
213
-
214
-
215
-
216
-
217
-
218
-
219
-
220
-
221
-
222
-
223
-
224
-
225
-
226
-
227
-
228
-
229
-
230
-
231
-
232
 |
 |

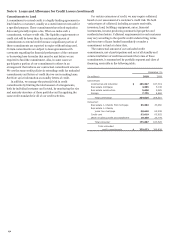
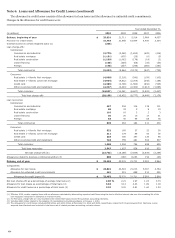
Note 6: Loans and Allowance for Credit Losses (continued)
Credit Quality
We monitor credit quality as indicated by evaluating various
attributes and utilize such information in our evaluation of the
adequacy of the allowance for credit losses. The following
sections provide the credit quality indicators we most closely
monitor. The majority of credit quality indicators are based on
December 31, 2010, information, with the exception of updated
FICO and updated loan-to-value (LTV)/combined LTV (CLTV),
which are obtained at least quarterly. Generally, these indicators
are updated in the second month of each quarter, with updates
no older than September 30, 2010.
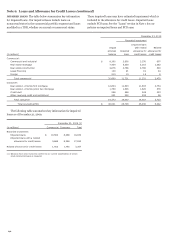
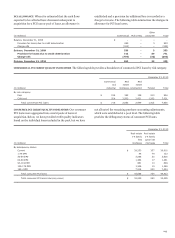
COMMERCIAL CREDIT QUALITY INDICATORS In addition to
monitoring commercial loan concentration risk, we manage a
consistent process for assessing commercial loan credit quality.
Commercial loans are subject to individual risk assessment using
our internal borrower and collateral quality ratings. Our ratings
are aligned to Pass and Criticized categories. The Criticized
category includes Special Mention, Substandard, and Doubtful
categories which are defined by banking regulatory agencies.
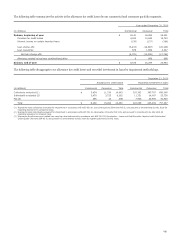
The table below provides a breakdown of outstanding
commercial loans (excluding PCI loans) by risk category. Both
the CRE mortgage and construction criticized totals are
relatively high as a result of the current conditions in the real
estate market. Of the $37.1 billion in criticized CRE loans,
$7.9 billion has been placed on nonaccrual status and written
down to net realizable value. Loans in both populations have a
high level of surveillance and monitoring in place to manage
these assets and mitigate any loss exposure. See the “Purchased
Credit-Impaired Loans” section of this Note for credit quality
information on our commercial PCI portfolio.
December 31, 2010
Commercial
Real
Real
and
estate
estate
Lease
(in millions) industrial
mortgage
construction
financing
Foreign
Total
By risk category:
Pass $ 126,058
70,597
11,256
12,411
30,341
250,663
Criticized 24,508
25,983
11,128
683
1,158
63,460
Total commercial loans (excluding PCI) $ 150,566
96,580
22,384
13,094
31,499
314,123
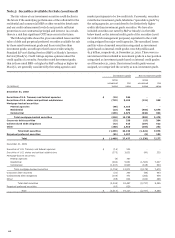
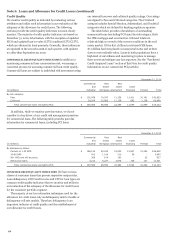
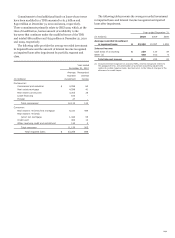
In addition, while we monitor past due status, we do not
consider it a key driver of our credit risk management practices
for commercial loans. The following table provides past due
information for commercial loans, excluding PCI loans.
December 31, 2010
Commercial
Real
Real
and
estate
estate
Lease
(in millions) industrial
mortgage
construction
financing
Foreign
Total
By delinquency status:
Current or 1-29 DPD $ 146,135
90,233
19,005
12,927
31,350
299,650
30-89 DPD 910
1,016
510
59
-
2,495
90+ DPD and still accruing 308
104
193
-
22
627
Nonaccrual loans 3,213
5,227
2,676
108
127
11,351
Total commercial loans (excluding PCI) $ 150,566
96,580
22,384
13,094
31,499
314,123
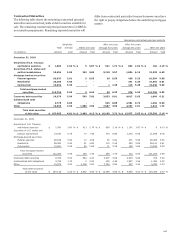
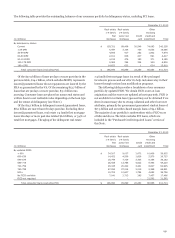
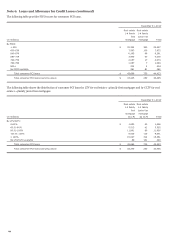
CONSUMER CREDIT QUALITY INDICATORS We have various
classes of consumer loans that present respective unique risks.
Loan delinquency, FICO credit scores and LTV for loan types are
common credit quality indicators that we monitor and utilize in
our evaluation of the adequacy of the allowance for credit losses
for the consumer portfolio segment.
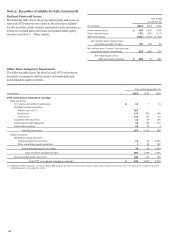
The majority of our loss estimation techniques used for the
allowance for credit losses rely on delinquency matrix models or
delinquency roll rate models. Therefore, delinquency is an
important indicator of credit quality and the establishment of
our allowance for credit losses.
136