Wells Fargo 2010 Annual Report Download - page 38
Download and view the complete annual report
Please find page 38 of the 2010 Wells Fargo annual report below. You can navigate through the pages in the report by either clicking on the pages listed below, or by using the keyword search tool below to find specific information within the annual report.-
 1
1 -
2
-
3
-
4
-
5
-
6
-
7
-
8
-
9
-
10
-
11
-
12
-
13
-
14
-
15
-
16
-
17
-
18
-
19
-
20
-
21
-
22
-
23
-
24
-
25
-
26
-
27
-
 28
28 -
 29
29 -
 30
30 -
 31
31 -
 32
32 -
 33
33 -
 34
34 -
 35
35 -
 36
36 -
 37
37 -
 38
38 -
 39
39 -
 40
40 -
 41
41 -
 42
42 -
 43
43 -
 44
44 -
 45
45 -
 46
46 -
 47
47 -
 48
48 -
49
-
50
-
51
-
52
-
53
-
54
-
55
-
56
-
57
-
58
-
59
-
60
-
61
-
62
-
63
-
64
-
65
-
66
-
67
-
68
-
69
-
70
-
71
-
72
-
73
-
74
-
75
-
76
-
77
-
78
-
79
-
80
-
81
-
82
-
83
-
84
-
85
-
86
-
87
-
88
-
89
-
90
-
91
-
92
-
93
-
94
-
95
-
96
-
97
-
98
-
99
-
100
-
101
-
102
-
103
-
104
-
105
-
106
-
107
-
108
-
109
-
110
-
111
-
112
-
113
-
114
-
115
-
116
-
117
-
118
-
119
-
120
-
121
-
122
-
123
-
124
-
125
-
126
-
127
-
128
-
129
-
130
-
131
-
132
-
133
-
134
-
135
-
136
-
137
-
138
-
139
-
140
-
141
-
142
-
143
-
144
-
145
-
146
-
147
-
148
-
149
-
150
-
151
-
152
-
153
-
154
-
155
-
156
-
157
-
158
-
159
-
160
-
161
-
162
-
163
-
164
-
165
-
166
-
167
-
168
-
169
-
170
-
171
-
172
-
173
-
174
-
175
-
176
-
177
-
178
-
179
-
180
-
181
-
182
-
183
-
184
-
185
-
186
-
187
-
188
-
189
-
190
-
191
-
192
-
193
-
194
-
195
-
196
-
197
-
198
-
199
-
200
-
201
-
202
-
203
-
204
-
205
-
206
-
207
-
208
-
209
-
210
-
211
-
212
-
213
-
214
-
215
-
216
-
217
-
218
-
219
-
220
-
221
-
222
-
223
-
224
-
225
-
226
-
227
-
228
-
229
-
230
-
231
-
232
 |
 |

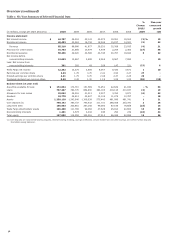
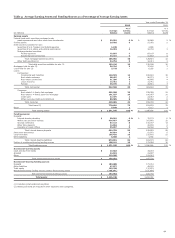
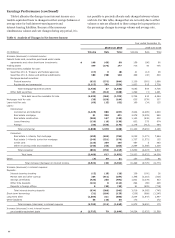
Overview (continued)
Table 1: Six-Year Summary of Selected Financial Data
%
Five-year
Change
compound
2010/
growth
(in millions, except per share amounts) 2010
2009
2008
2007
2006
2005
2009
rate
Income statement
Net interest income $ 44,757
46,324
25,143
20,974
19,951
18,504
(3)
%
19
Noninterest income 40,453
42,362
16,734
18,546
15,817
14,591
(5)
23
Revenue 85,210
88,686
41,877
39,520
35,768
33,095
(4)
21
Provision for credit losses 15,753
21,668
15,979
4,939
2,204
2,383
(27)
46
Noninterest expense 50,456
49,020
22,598
22,746
20,767
18,943
3
22
Net income before
noncontrolling interests 12,663
12,667
2,698
8,265
8,567
7,892
-
10
Less: Net income from
noncontrolling interests 301
392
43
208
147
221
(23)
6
Wells Fargo net income 12,362
12,275
2,655
8,057
8,420
7,671
1
10
Earnings per common share 2.23
1.76
0.70
2.41
2.50
2.27
27
-
Diluted earnings per common share 2.21
1.75
0.70
2.38
2.47
2.25
26
-
Dividends declared per common share 0.20
0.49
1.30
1.18
1.08
1.00
(59)
(28)
Balance sheet (at year end)
Securities available for sale $ 172,654
172,710
151,569
72,951
42,629
41,834
-
%
33
Loans 757,267
782,770
864,830
382,195
319,116
310,837
(3)
19
Allowance for loan losses 23,022
24,516
21,013
5,307
3,764
3,871
(6)
43
Goodwill 24,770
24,812
22,627
13,106
11,275
10,787
-
18
Assets 1,258,128
1,243,646
1,309,639
575,442
481,996
481,741
1
21
Core deposits (1) 798,192
780,737
745,432
311,731
288,068
253,341
2
26
Long-term debt 156,983
203,861
267,158
99,393
87,145
79,668
(23)
15
Wells Fargo stockholders' equity 126,408
111,786
99,084
47,628
45,814
40,660
13
25
Noncontrolling interests 1,481
2,573
3,232
286
254
239
(42)
44
Total equity 127,889
114,359
102,316
47,914
46,068
40,899
12
26
(1)
Core deposits are noninterest-bearing deposits, interest-bearing checking, savings certificates, certain market rate and other savings, and certain foreign deposits
(Eurodollar sweep balances).
36