Wells Fargo 2010 Annual Report Download - page 204
Download and view the complete annual report
Please find page 204 of the 2010 Wells Fargo annual report below. You can navigate through the pages in the report by either clicking on the pages listed below, or by using the keyword search tool below to find specific information within the annual report.-
 1
1 -
2
-
3
-
4
-
5
-
6
-
7
-
8
-
9
-
10
-
11
-
12
-
13
-
14
-
15
-
16
-
17
-
18
-
19
-
20
-
21
-
22
-
23
-
24
-
25
-
26
-
27
-
28
-
29
-
30
-
31
-
32
-
33
-
34
-
35
-
36
-
37
-
38
-
39
-
40
-
41
-
42
-
43
-
44
-
45
-
46
-
47
-
48
-
49
-
50
-
51
-
52
-
53
-
54
-
55
-
56
-
57
-
58
-
59
-
60
-
61
-
62
-
63
-
64
-
65
-
66
-
67
-
68
-
69
-
70
-
71
-
72
-
73
-
74
-
75
-
76
-
77
-
78
-
79
-
80
-
81
-
82
-
83
-
84
-
85
-
86
-
87
-
88
-
89
-
90
-
91
-
92
-
93
-
94
-
95
-
96
-
97
-
98
-
99
-
100
-
101
-
102
-
103
-
104
-
105
-
106
-
107
-
108
-
109
-
110
-
111
-
112
-
113
-
114
-
115
-
116
-
117
-
118
-
119
-
120
-
121
-
122
-
123
-
124
-
125
-
126
-
127
-
128
-
129
-
130
-
131
-
132
-
133
-
134
-
135
-
136
-
137
-
138
-
139
-
140
-
141
-
142
-
143
-
144
-
145
-
146
-
147
-
148
-
149
-
150
-
151
-
152
-
153
-
154
-
155
-
156
-
157
-
158
-
159
-
160
-
161
-
162
-
163
-
164
-
165
-
166
-
167
-
168
-
169
-
170
-
171
-
172
-
173
-
174
-
175
-
176
-
177
-
178
-
179
-
180
-
181
-
182
-
183
-
184
-
185
-
186
-
187
-
188
-
189
-
190
-
191
-
192
-
193
-
 194
194 -
 195
195 -
 196
196 -
 197
197 -
 198
198 -
 199
199 -
 200
200 -
 201
201 -
 202
202 -
 203
203 -
 204
204 -
 205
205 -
 206
206 -
 207
207 -
 208
208 -
 209
209 -
 210
210 -
 211
211 -
 212
212 -
 213
213 -
 214
214 -
215
-
216
-
217
-
218
-
219
-
220
-
221
-
222
-
223
-
224
-
225
-
226
-
227
-
228
-
229
-
230
-
231
-
232
 |
 |

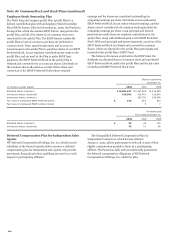
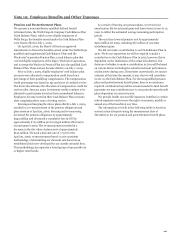
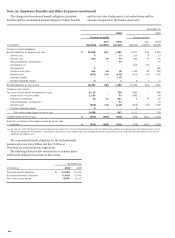
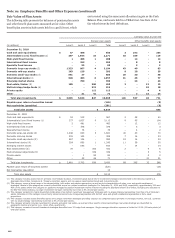
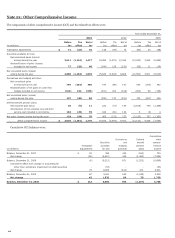
Note 19: Employee Benefits and Other Expenses (continued)
The changes in the projected benefit obligation of pension
benefits and the accumulated benefit obligation of other benefits
and the fair value of plan assets, the funded status and the
amounts recognized in the balance sheet were:
December 31,
2010
2009
Pension benefits
Pension benefits
Non-
Other
Non-
Other
(in millions) Qualified
qualified
benefits
Qualified
qualified
benefits
Change in benefit obligation:
Benefit obligation at beginning of year $
10,038
681
1,401
8,977
684
1,325
Service cost
5
-
13
210
8
13
Interest cost
554
37
78
595
43
83
Plan participants’ contributions
-
-
74
-
-
79
Curtailment (1)
-
-
-
(910)
(35)
-
Amendments
2
-
-
-
-
(54)
Actuarial loss (gain)
386
46
(5)
1,763
59
120
Benefits paid
(652)
(71)
(147)
(605)
(79)
(167)
Liability transfer
-
-
(17)
-
-
-
Foreign exchange impact
4
-
1
8
1
2
Benefit obligation at end of year
10,337
693
1,398
10,038
681
1,401
Change in plan assets:
Fair value of plan assets at beginning of year 9,112
-
376
7,863
-
368
Actual return on plan assets 1,163
-
33
1,842
-
48
Employer contribution
12
71
361
4
79
48
Plan participants’ contributions
-
-
74
-
-
79
Benefits paid
(652)
(71)
(147)
(605)
(79)
(167)
Foreign exchange impact
4
-
-
8
-
-
Fair value of plan assets at end of year
9,639
-
697
9,112
-
376
Funded status at end of year $
(698)
(693)
(701)
(926)
(681)
(1,025)
Amounts recognized in the balance sheet at end of year:
Liabilities $
(698)
(693)
(701)
(926)
(681)
(1,025)
(1) On April 28, 2009, the Board of Directors approved amendments to freeze the benefits earned under the Wells Fargo qualified and supplemental Cash Balance Plans and the
Wachovia Corporation Pension Plan, a cash balance plan that covered eligible employees of legacy Wachovia Corporation, and to merge the Wachovia Pension Plan into the
qualified Cash Balance Plan.
The accumulated benefit obligation for the defined benefit
pension plans was $11.0 billion and $10.7 billion at
December 31, 2010 and 2009, respectively.
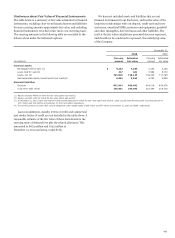
The following table provides information for pension plans
with benefit obligations in excess of plan assets.
December 31,
(in millions) 2010
2009
Projected benefit obligation $ 11,030
10,719
Accumulated benefit obligation 11,019
10,706
Fair value of plan assets 9,639
9,112
202