Wells Fargo 2010 Annual Report Download - page 126
Download and view the complete annual report
Please find page 126 of the 2010 Wells Fargo annual report below. You can navigate through the pages in the report by either clicking on the pages listed below, or by using the keyword search tool below to find specific information within the annual report.-
 1
1 -
2
-
3
-
4
-
5
-
6
-
7
-
8
-
9
-
10
-
11
-
12
-
13
-
14
-
15
-
16
-
17
-
18
-
19
-
20
-
21
-
22
-
23
-
24
-
25
-
26
-
27
-
28
-
29
-
30
-
31
-
32
-
33
-
34
-
35
-
36
-
37
-
38
-
39
-
40
-
41
-
42
-
43
-
44
-
45
-
46
-
47
-
48
-
49
-
50
-
51
-
52
-
53
-
54
-
55
-
56
-
57
-
58
-
59
-
60
-
61
-
62
-
63
-
64
-
65
-
66
-
67
-
68
-
69
-
70
-
71
-
72
-
73
-
74
-
75
-
76
-
77
-
78
-
79
-
80
-
81
-
82
-
83
-
84
-
85
-
86
-
87
-
88
-
89
-
90
-
91
-
92
-
93
-
94
-
95
-
96
-
97
-
98
-
99
-
100
-
101
-
102
-
103
-
104
-
105
-
106
-
107
-
108
-
109
-
110
-
111
-
112
-
113
-
114
-
115
-
 116
116 -
 117
117 -
 118
118 -
 119
119 -
 120
120 -
 121
121 -
 122
122 -
 123
123 -
 124
124 -
 125
125 -
 126
126 -
 127
127 -
 128
128 -
 129
129 -
 130
130 -
 131
131 -
 132
132 -
 133
133 -
 134
134 -
 135
135 -
 136
136 -
137
-
138
-
139
-
140
-
141
-
142
-
143
-
144
-
145
-
146
-
147
-
148
-
149
-
150
-
151
-
152
-
153
-
154
-
155
-
156
-
157
-
158
-
159
-
160
-
161
-
162
-
163
-
164
-
165
-
166
-
167
-
168
-
169
-
170
-
171
-
172
-
173
-
174
-
175
-
176
-
177
-
178
-
179
-
180
-
181
-
182
-
183
-
184
-
185
-
186
-
187
-
188
-
189
-
190
-
191
-
192
-
193
-
194
-
195
-
196
-
197
-
198
-
199
-
200
-
201
-
202
-
203
-
204
-
205
-
206
-
207
-
208
-
209
-
210
-
211
-
212
-
213
-
214
-
215
-
216
-
217
-
218
-
219
-
220
-
221
-
222
-
223
-
224
-
225
-
226
-
227
-
228
-
229
-
230
-
231
-
232
 |
 |

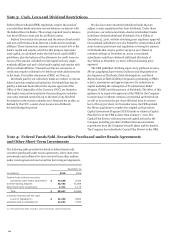
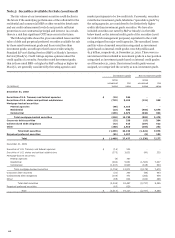
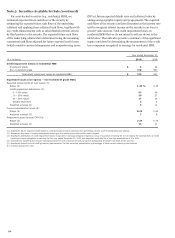
Note 5: Securities Available for Sale (continued)
As part of our liquidity management strategy, we pledge
securities to secure borrowings from the FHLB and the Federal
Reserve Bank. We also pledge securities to secure trust and
public deposits and for other purposes as required or permitted
by law. Securities pledged where the secured party does not have
the right to sell or repledge totaled $94.2 billion and
$98.9 billion at December 31, 2010 and 2009, respectively. We
did not pledge any securities where the secured party has the
right to sell or repledge the collateral as of the same periods,
respectively.
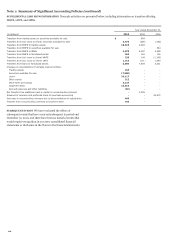
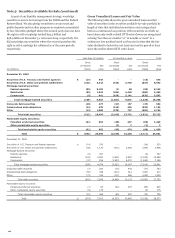
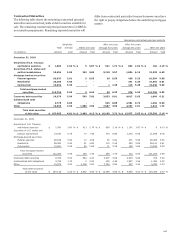
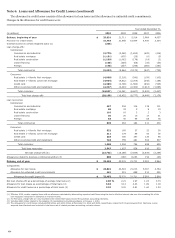
Gross Unrealized Losses and Fair Value
The following table shows the gross unrealized losses and fair
value of securities in the securities available-for-sale portfolio by
length of time that individual securities in each category had
been in a continuous loss position. Debt securities on which we
have taken only credit-related OTTI write-downs are categorized
as being “less than 12 months” or “12 months or more” in a
continuous loss position based on the point in time that the fair
value declined to below the cost basis and not the period of time
since the credit-related OTTI write-down.
Less than 12 months
12 months or more
Total
Gross
Gross
Gross
unrealized
Fair
unrealized
Fair
unrealized
Fair
(in millions) losses
value
losses
value
losses
value
December 31, 2010
Securities of U.S. Treasury and federal agencies $ (15)
544
-
-
(15)
544
Securities of U.S. states and political subdivisions (322)
6,242
(515)
2,720
(837)
8,962
Mortgage-backed securities:
Federal agencies (95)
8,103
(1)
60
(96)
8,163
Residential (35)
1,023
(454)
4,440
(489)
5,463
Commercial (9)
441
(626)
5,141
(635)
5,582
Total mortgage-backed securities (139)
9,567
(1,081)
9,641
(1,220)
19,208
Corporate debt securities (10)
477
(27)
157
(37)
634
Collateralized debt obligations (13)
679
(216)
456
(229)
1,135
Other (13)
1,985
(270)
757
(283)
2,742
Total debt securities (512)
19,494
(2,109)
13,731
(2,621)
33,225
Marketable equity securities:
Perpetual preferred securities (41)
962
(48)
467
(89)
1,429
Other marketable equity securities -
-
(1)
7
(1)
7
Total marketable equity securities (41)
962
(49)
474
(90)
1,436
Total $ (553)
20,456
(2,158)
14,205
(2,711)
34,661
December 31, 2009
Securities of U.S. Treasury and federal agencies $ (14)
530
-
-
(14)
530
Securities of U.S. states and political subdivisions (55)
1,120
(310)
2,826
(365)
3,946
Mortgage-backed securities:
Federal agencies (9)
767
-
-
(9)
767
Residential (243)
2,991
(1,800)
9,697
(2,043)
12,688
Commercial (37)
816
(1,825)
6,370
(1,862)
7,186
Total mortgage-backed securities (289)
4,574
(3,625)
16,067
(3,914)
20,641
Corporate debt securities (7)
281
(70)
442
(77)
723
Collateralized debt obligations (55)
398
(312)
512
(367)
910
Other (73)
746
(172)
286
(245)
1,032
Total debt securities (493)
7,649
(4,489)
20,133
(4,982)
27,782
Marketable equity securities:
Perpetual preferred securities (1)
93
(64)
527
(65)
620
Other marketable equity securities (9)
175
-
-
(9)
175
Total marketable equity securities (10)
268
(64)
527
(74)
795
Total $ (503)
7,917
(4,553)
20,660
(5,056)
28,577
124