Wells Fargo 2010 Annual Report Download - page 67
Download and view the complete annual report
Please find page 67 of the 2010 Wells Fargo annual report below. You can navigate through the pages in the report by either clicking on the pages listed below, or by using the keyword search tool below to find specific information within the annual report.-
 1
1 -
2
-
3
-
4
-
5
-
6
-
7
-
8
-
9
-
10
-
11
-
12
-
13
-
14
-
15
-
16
-
17
-
18
-
19
-
20
-
21
-
22
-
23
-
24
-
25
-
26
-
27
-
28
-
29
-
30
-
31
-
32
-
33
-
34
-
35
-
36
-
37
-
38
-
39
-
40
-
41
-
42
-
43
-
44
-
45
-
46
-
47
-
48
-
49
-
50
-
51
-
52
-
53
-
54
-
55
-
56
-
 57
57 -
 58
58 -
 59
59 -
 60
60 -
 61
61 -
 62
62 -
 63
63 -
 64
64 -
 65
65 -
 66
66 -
 67
67 -
 68
68 -
 69
69 -
 70
70 -
 71
71 -
 72
72 -
 73
73 -
 74
74 -
 75
75 -
 76
76 -
 77
77 -
78
-
79
-
80
-
81
-
82
-
83
-
84
-
85
-
86
-
87
-
88
-
89
-
90
-
91
-
92
-
93
-
94
-
95
-
96
-
97
-
98
-
99
-
100
-
101
-
102
-
103
-
104
-
105
-
106
-
107
-
108
-
109
-
110
-
111
-
112
-
113
-
114
-
115
-
116
-
117
-
118
-
119
-
120
-
121
-
122
-
123
-
124
-
125
-
126
-
127
-
128
-
129
-
130
-
131
-
132
-
133
-
134
-
135
-
136
-
137
-
138
-
139
-
140
-
141
-
142
-
143
-
144
-
145
-
146
-
147
-
148
-
149
-
150
-
151
-
152
-
153
-
154
-
155
-
156
-
157
-
158
-
159
-
160
-
161
-
162
-
163
-
164
-
165
-
166
-
167
-
168
-
169
-
170
-
171
-
172
-
173
-
174
-
175
-
176
-
177
-
178
-
179
-
180
-
181
-
182
-
183
-
184
-
185
-
186
-
187
-
188
-
189
-
190
-
191
-
192
-
193
-
194
-
195
-
196
-
197
-
198
-
199
-
200
-
201
-
202
-
203
-
204
-
205
-
206
-
207
-
208
-
209
-
210
-
211
-
212
-
213
-
214
-
215
-
216
-
217
-
218
-
219
-
220
-
221
-
222
-
223
-
224
-
225
-
226
-
227
-
228
-
229
-
230
-
231
-
232
 |
 |

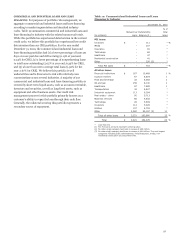
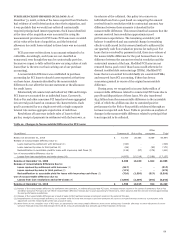
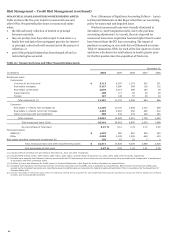
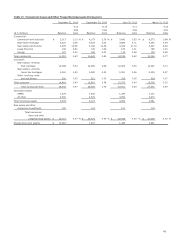
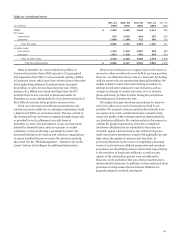
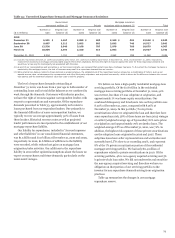
Table 27: Nonaccrual Loans and Other Nonperforming Assets During 2010
December 31, 2010
September 30, 2010
June 30, 2010
March 31, 2010
% of
% of
% of
% of
total
total
total
total
($ in millions)
Balances
loans
Balances
loans
Balances
loans
Balances
loans
Commercial:
Commercial and industrial $ 3,213
2.12
%
$ 4,103
2.79
%
$ 3,843
2.63
% $ 4,273
2.84
%
Real estate mortgage 5,227
5.26
5,079
5.14
4,689
4.71
4,345
4.44
Real estate construction 2,676
10.56
3,198
11.46
3,429
11.10
3,327
9.64
Lease financing 108
0.82
138
1.06
163
1.21
185
1.33
Foreign 127
0.39
126
0.42
115
0.38
135
0.48
Total commercial 11,351
3.52
12,644
3.99
12,239
3.82
12,265
3.77
Consumer:
Real estate 1-4 family
first mortgage 12,289
5.34
12,969
5.69
12,865
5.50
12,347
5.13
Real estate 1-4 family
junior lien mortgage 2,302
2.39
2,380
2.40
2,391
2.36
2,355
2.27
Other revolving credit
and installment 300
0.35
312
0.35
316
0.36
334
0.37
Total consumer 14,891
3.42
15,661
3.58
15,572
3.49
15,036
3.30
Total nonaccrual loans 26,242
3.47
28,305
3.76
27,811
3.63
27,301
3.49
Foreclosed assets:
GNMA 1,479
1,492
1,344
1,111
All other 4,530
4,635
3,650
2,970
Total foreclosed assets 6,009
6,127
4,994
4,081
Real estate and other
nonaccrual investments 120
141
131
118
Total nonaccrual
loans and other
nonperforming assets $ 32,371
4.27
%
$ 34,573
4.59
%
$ 32,936
4.30
% $ 31,500
4.03
%
Change from prior quarter $ (2,202)
1,637
1,436
3,861
65