Wells Fargo 2010 Annual Report Download - page 69
Download and view the complete annual report
Please find page 69 of the 2010 Wells Fargo annual report below. You can navigate through the pages in the report by either clicking on the pages listed below, or by using the keyword search tool below to find specific information within the annual report.-
 1
1 -
2
-
3
-
4
-
5
-
6
-
7
-
8
-
9
-
10
-
11
-
12
-
13
-
14
-
15
-
16
-
17
-
18
-
19
-
20
-
21
-
22
-
23
-
24
-
25
-
26
-
27
-
28
-
29
-
30
-
31
-
32
-
33
-
34
-
35
-
36
-
37
-
38
-
39
-
40
-
41
-
42
-
43
-
44
-
45
-
46
-
47
-
48
-
49
-
50
-
51
-
52
-
53
-
54
-
55
-
56
-
57
-
58
-
 59
59 -
 60
60 -
 61
61 -
 62
62 -
 63
63 -
 64
64 -
 65
65 -
 66
66 -
 67
67 -
 68
68 -
 69
69 -
 70
70 -
 71
71 -
 72
72 -
 73
73 -
 74
74 -
 75
75 -
 76
76 -
 77
77 -
 78
78 -
 79
79 -
80
-
81
-
82
-
83
-
84
-
85
-
86
-
87
-
88
-
89
-
90
-
91
-
92
-
93
-
94
-
95
-
96
-
97
-
98
-
99
-
100
-
101
-
102
-
103
-
104
-
105
-
106
-
107
-
108
-
109
-
110
-
111
-
112
-
113
-
114
-
115
-
116
-
117
-
118
-
119
-
120
-
121
-
122
-
123
-
124
-
125
-
126
-
127
-
128
-
129
-
130
-
131
-
132
-
133
-
134
-
135
-
136
-
137
-
138
-
139
-
140
-
141
-
142
-
143
-
144
-
145
-
146
-
147
-
148
-
149
-
150
-
151
-
152
-
153
-
154
-
155
-
156
-
157
-
158
-
159
-
160
-
161
-
162
-
163
-
164
-
165
-
166
-
167
-
168
-
169
-
170
-
171
-
172
-
173
-
174
-
175
-
176
-
177
-
178
-
179
-
180
-
181
-
182
-
183
-
184
-
185
-
186
-
187
-
188
-
189
-
190
-
191
-
192
-
193
-
194
-
195
-
196
-
197
-
198
-
199
-
200
-
201
-
202
-
203
-
204
-
205
-
206
-
207
-
208
-
209
-
210
-
211
-
212
-
213
-
214
-
215
-
216
-
217
-
218
-
219
-
220
-
221
-
222
-
223
-
224
-
225
-
226
-
227
-
228
-
229
-
230
-
231
-
232
 |
 |

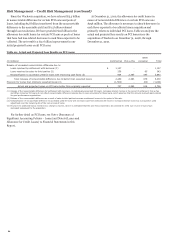
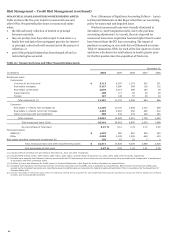
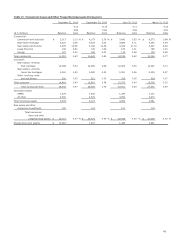
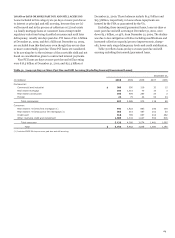
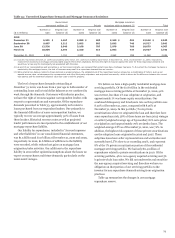
Table 29: Foreclosed Assets
Dec. 31,
Sept. 30,
June 30,
Mar. 31,
Dec. 31,
(in millions)
2010
2010
2010
2010
2009
GNMA $
1,479
1,492
1,344
1,111
960
PCI loans:
Commercial
967
1,043
940
697
405
Consumer
1,068
1,109
722
490
336
Total PCI loans
2,035
2,152
1,662
1,187
741
All other loans:
Commercial
1,412
1,343
1,087
820
655
Consumer
1,083
1,140
901
963
803
Total all other loans
2,495
2,483
1,988
1,783
1,458
Total foreclosed assets $
6,009
6,127
4,994
4,081
3,159
NPAs at December 31, 2010, included $1.5 billion of
foreclosed real estate that is FHA insured or VA guaranteed
and expected to have little to no loss content, and $4.5 billion
of foreclosed assets, which have been written down to the value
of the underlying collateral. Foreclosed assets increased
$2.9 billion, or 90%, in 2010 from the prior year. Of this
increase, $1.3 billion were foreclosed loans from the PCI
portfolio that are now recorded as foreclosed assets. At
December 31, 2010, substantially all of our foreclosed assets of
$6.0 billion have been in the portfolio one year or less.
Given our real estate-secured loan concentrations and
current economic conditions, we anticipate continuing to hold
a high level of NPAs on our balance sheet. The loss content in
the nonaccrual loans has been recognized through charge-offs
or provided for in the allowance for credit losses at
December 31, 2010. The performance of any one loan can be
affected by external factors, such as economic or market
conditions, or factors affecting a particular borrower. We
increased staffing in our workout and collection organizations
to ensure troubled borrowers receive the attention and help
they need. See the “Risk Management – Allowance for Credit
Losses” section in this Report for additional information.
We process foreclosures on a regular basis for the loans we
service for others as well as those we hold in our loan portfolio.
However, we utilize foreclosure only as a last resort for dealing
with borrowers who are experiencing financial hardships. We
employ extensive contact and restructuring procedures to
attempt to find other solutions for our borrowers, and on
average we attempt to contact borrowers over 75 times by
phone and nearly 50 times by letter during the period from
first delinquency to foreclosure sale.
We employ the same foreclosure procedures for loans we
service for others as we use for loans that we hold in our
portfolio. We transmit customer and loan data directly from
our system of record to outside foreclosure counsel to help
ensure the quality of the customer and loan data included in
our foreclosure affidavits. We continuously test this process to
confirm the proper transmission of the data. Completed
foreclosure affidavits that are submitted to the courts are
reviewed, signed, and notarized as one of the last steps in a
multi-step process intended to comply with applicable law and
help ensure the quality of customer and loan data. As
previously disclosed, in the course of completing a thorough
review of our foreclosure affidavit preparation and execution
procedures, we did identify practices where final steps relating
to the execution of foreclosure affidavits, as well as some
aspects of the notarization process were not adhered to.
However, we do not believe that any of these practices led to
unwarranted foreclosures. In addition, we have enhanced those
procedures to help ensure that foreclosure affidavits are
properly prepared, reviewed, and signed.
67