Wells Fargo 2010 Annual Report Download - page 43
Download and view the complete annual report
Please find page 43 of the 2010 Wells Fargo annual report below. You can navigate through the pages in the report by either clicking on the pages listed below, or by using the keyword search tool below to find specific information within the annual report.-
 1
1 -
2
-
3
-
4
-
5
-
6
-
7
-
8
-
9
-
10
-
11
-
12
-
13
-
14
-
15
-
16
-
17
-
18
-
19
-
20
-
21
-
22
-
23
-
24
-
25
-
26
-
27
-
28
-
29
-
30
-
31
-
32
-
 33
33 -
 34
34 -
 35
35 -
 36
36 -
 37
37 -
 38
38 -
 39
39 -
 40
40 -
 41
41 -
 42
42 -
 43
43 -
 44
44 -
 45
45 -
 46
46 -
 47
47 -
 48
48 -
 49
49 -
 50
50 -
 51
51 -
 52
52 -
 53
53 -
54
-
55
-
56
-
57
-
58
-
59
-
60
-
61
-
62
-
63
-
64
-
65
-
66
-
67
-
68
-
69
-
70
-
71
-
72
-
73
-
74
-
75
-
76
-
77
-
78
-
79
-
80
-
81
-
82
-
83
-
84
-
85
-
86
-
87
-
88
-
89
-
90
-
91
-
92
-
93
-
94
-
95
-
96
-
97
-
98
-
99
-
100
-
101
-
102
-
103
-
104
-
105
-
106
-
107
-
108
-
109
-
110
-
111
-
112
-
113
-
114
-
115
-
116
-
117
-
118
-
119
-
120
-
121
-
122
-
123
-
124
-
125
-
126
-
127
-
128
-
129
-
130
-
131
-
132
-
133
-
134
-
135
-
136
-
137
-
138
-
139
-
140
-
141
-
142
-
143
-
144
-
145
-
146
-
147
-
148
-
149
-
150
-
151
-
152
-
153
-
154
-
155
-
156
-
157
-
158
-
159
-
160
-
161
-
162
-
163
-
164
-
165
-
166
-
167
-
168
-
169
-
170
-
171
-
172
-
173
-
174
-
175
-
176
-
177
-
178
-
179
-
180
-
181
-
182
-
183
-
184
-
185
-
186
-
187
-
188
-
189
-
190
-
191
-
192
-
193
-
194
-
195
-
196
-
197
-
198
-
199
-
200
-
201
-
202
-
203
-
204
-
205
-
206
-
207
-
208
-
209
-
210
-
211
-
212
-
213
-
214
-
215
-
216
-
217
-
218
-
219
-
220
-
221
-
222
-
223
-
224
-
225
-
226
-
227
-
228
-
229
-
230
-
231
-
232
 |
 |

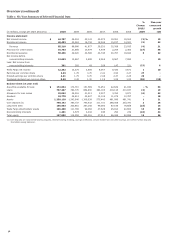
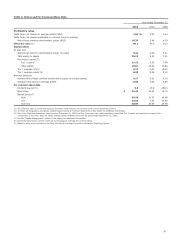
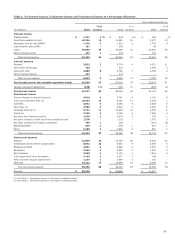
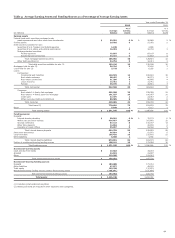
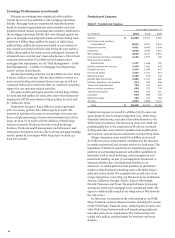
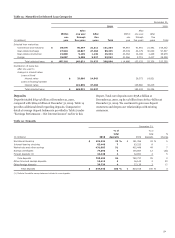
Table 4: Average Earning Assets and Funding Sources as a Percentage of Average Earning Assets
Year ended December 31,
2010
2009
% of
% of
Average
earning
Average
earning
(in millions) balance
assets
balance
assets
Earning assets
Federal funds sold, securities purchased under
resale agreements and other short-term investments $ 62,961
6
%
$ 26,869
2
%
Trading assets 29,920
3
21,092
2
Debt securities available for sale:
Securities of U.S. Treasury and federal agencies
1,926
-
2,480
-
Securities of U.S. states and political subdivisions 16,392
2
12,702
1
Mortgage-backed securities:
Federal agencies 75,875
7
87,197
8
Residential and commercial 33,191
3
41,618
4
Total mortgage-backed securities 109,066
10
128,815
12
Other debt securities (1) 34,752
3
32,011
3
Total debt securities available for sale (1) 162,136
15
176,008
16
Mortgages held for sale (2) 36,716
3
37,416
3
Loans held for sale (2) 3,773
-
6,293
1
Loans:
Commercial:
Commercial and industrial 149,576
14
180,924
16
Real estate mortgage 98,497
9
96,273
9
Real estate construction 31,286
3
40,885
4
Lease financing 13,451
1
14,751
1
Foreign 29,726
3
30,661
3
Total commercial 322,536
30
363,494
33
Consumer:
Real estate 1-4 family first mortgage 235,568
22
238,359
22
Real estate 1-4 family junior lien mortgage 101,537
10
106,957
10
Credit card 22,375
2
23,357
2
Other revolving credit and installment 88,585
8
90,666
8
Total consumer 448,065
42
459,339
42
Total loans (2) 770,601
72
822,833
75
Other 5,849
1
6,113
1
Total earning assets $ 1,071,956
100
%
$ 1,096,624
100
%
Funding sources
Deposits:
Interest-bearing checking $ 60,941
6
%
$ 70,179
6
%
Market rate and other savings 416,877
39
351,892
32
Savings certificates 87,133
8
140,197
13
Other time deposits 14,654
1
20,459
2
Deposits in foreign offices 55,097
5
53,166
5
Total interest-bearing deposits 634,702
59
635,893
58
Short-term borrowings 46,824
4
51,972
5
Long-term debt 185,426
18
231,801
21
Other liabilities 6,863
1
4,904
-
Total interest-bearing liabilities 873,815
82
924,570
84
Portion of noninterest-bearing funding sources 198,141
18
172,054
16
Total funding sources $ 1,071,956
100
%
$ 1,096,624
100
%
Noninterest-earning assets
Cash and due from banks $ 17,618
19,218
Goodwill 24,824
23,997
Other 112,540
122,515
Total noninterest-earning assets $ 154,982
165,730
Noninterest-bearing funding sources
Deposits $ 183,008
171,712
Other liabilities 47,877
48,193
Total equity 122,238
117,879
Noninterest-bearing funding sources used to fund earning assets (198,141)
(172,054)
Net noninterest-bearing funding sources $ 154,982
165,730
Total assets $ 1,226,938
1,262,354
(1) Includes certain preferred securities.
(2) Nonaccrual loans are included in their respective loan categories.
41