Wells Fargo 2010 Annual Report Download - page 131
Download and view the complete annual report
Please find page 131 of the 2010 Wells Fargo annual report below. You can navigate through the pages in the report by either clicking on the pages listed below, or by using the keyword search tool below to find specific information within the annual report.-
 1
1 -
2
-
3
-
4
-
5
-
6
-
7
-
8
-
9
-
10
-
11
-
12
-
13
-
14
-
15
-
16
-
17
-
18
-
19
-
20
-
21
-
22
-
23
-
24
-
25
-
26
-
27
-
28
-
29
-
30
-
31
-
32
-
33
-
34
-
35
-
36
-
37
-
38
-
39
-
40
-
41
-
42
-
43
-
44
-
45
-
46
-
47
-
48
-
49
-
50
-
51
-
52
-
53
-
54
-
55
-
56
-
57
-
58
-
59
-
60
-
61
-
62
-
63
-
64
-
65
-
66
-
67
-
68
-
69
-
70
-
71
-
72
-
73
-
74
-
75
-
76
-
77
-
78
-
79
-
80
-
81
-
82
-
83
-
84
-
85
-
86
-
87
-
88
-
89
-
90
-
91
-
92
-
93
-
94
-
95
-
96
-
97
-
98
-
99
-
100
-
101
-
102
-
103
-
104
-
105
-
106
-
107
-
108
-
109
-
110
-
111
-
112
-
113
-
114
-
115
-
116
-
117
-
118
-
119
-
120
-
 121
121 -
 122
122 -
 123
123 -
 124
124 -
 125
125 -
 126
126 -
 127
127 -
 128
128 -
 129
129 -
 130
130 -
 131
131 -
 132
132 -
 133
133 -
 134
134 -
 135
135 -
 136
136 -
 137
137 -
 138
138 -
 139
139 -
 140
140 -
 141
141 -
142
-
143
-
144
-
145
-
146
-
147
-
148
-
149
-
150
-
151
-
152
-
153
-
154
-
155
-
156
-
157
-
158
-
159
-
160
-
161
-
162
-
163
-
164
-
165
-
166
-
167
-
168
-
169
-
170
-
171
-
172
-
173
-
174
-
175
-
176
-
177
-
178
-
179
-
180
-
181
-
182
-
183
-
184
-
185
-
186
-
187
-
188
-
189
-
190
-
191
-
192
-
193
-
194
-
195
-
196
-
197
-
198
-
199
-
200
-
201
-
202
-
203
-
204
-
205
-
206
-
207
-
208
-
209
-
210
-
211
-
212
-
213
-
214
-
215
-
216
-
217
-
218
-
219
-
220
-
221
-
222
-
223
-
224
-
225
-
226
-
227
-
228
-
229
-
230
-
231
-
232
 |
 |

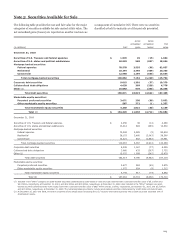
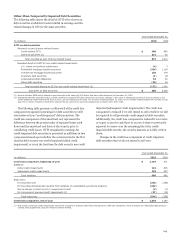
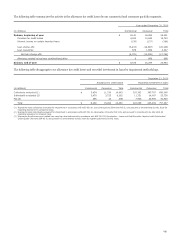
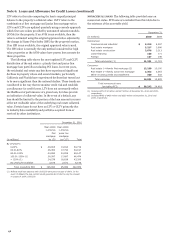
Other-Than-Temporarily Impaired Debt Securities
The following table shows the detail of OTTI write-downs on
debt securities available for sale included in earnings and the
related changes in OCI for the same securities.
Year ended December 31,
(in millions)
2010
2009
OTTI on debt securities
Recorded as part of gross realized losses:
Credit-related OTTI $
400
982
Intent-to-sell OTTI (1)
272
30
Total recorded as part of gross realized losses
672
1,012
Recorded directly to OCI for non-credit-related impairment:
U.S. states and political subdivisions
(4)
3
Residential mortgage-backed securities
(326)
1,124
Commercial mortgage-backed securities
138
179
Corporate debt securities
(1)
(2)
Collateralized debt obligations
54
20
Other debt securities
(33)
16
Total recorded directly to OCI for non-credit-related impairment (2)
(172)
1,340
Total OTTI on debt securities $
500
2,352
(1) Amount includes $252 million related to securities with a fair value of $14.5 billion that were sold subsequent to December 31, 2010.
(2) Represents amounts recorded to OCI on debt securities in periods OTTI write-downs have occurred. Changes in fair value in subsequent periods on such securities, to the
extent additional credit-related OTTI did not occur, are not reflected in this total. For the year ended December 31, 2010, the non-credit-related impairment recorded to OCI
was a $172 million reduction in total OTTI because the fair value of the security increased due to factors other than credit.
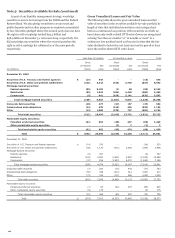
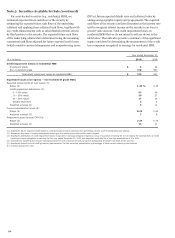
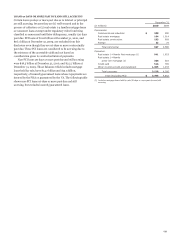
The following table presents a rollforward of the credit loss
component recognized in earnings for debt securities we still
own (referred to as “credit-impaired” debt securities). The
credit loss component of the amortized cost represents the
difference between the present value of expected future cash
flows and the amortized cost basis of the security prior to
considering credit losses. OTTI recognized in earnings for
credit-impaired debt securities is presented as additions in two
components based upon whether the current period is the first
time the debt security was credit-impaired (initial credit
impairment) or is not the first time the debt security was credit
impaired (subsequent credit impairments). The credit loss
component is reduced if we sell, intend to sell or believe we will
be required to sell previously credit-impaired debt securities.
Additionally, the credit loss component is reduced if we receive
or expect to receive cash flows in excess of what we previously
expected to receive over the remaining life of the credit-
impaired debt security, the security matures or is fully written
down.
Changes in the credit loss component of credit-impaired
debt securities that we do not intend to sell were:
Year ended December 31,
(in millions)
2010
2009
Credit loss component, beginning of year $
1,187
471
Additions:
Initial credit impairments 122
625
Subsequent credit impairments
278
357
Total additions
400
982
Reductions:
For securities sold
(263)
(255)
For securities derecognized resulting from adoption of consolidation accounting guidance
(242)
-
Due to change in intent to sell or requirement to sell
(2)
(1)
For recoveries of previous credit impairments (1)
(37)
(10)
Total reductions
(544)
(266)
Credit loss component, end of year $
1,043
1,187
(1) Recoveries of previous credit impairments result from increases in expected cash flows subsequent to credit loss recognition. Such recoveries are reflected prospectively as
interest yield adjustments using the effective interest method.
129