Wells Fargo 2010 Annual Report Download - page 106
Download and view the complete annual report
Please find page 106 of the 2010 Wells Fargo annual report below. You can navigate through the pages in the report by either clicking on the pages listed below, or by using the keyword search tool below to find specific information within the annual report.-
 1
1 -
2
-
3
-
4
-
5
-
6
-
7
-
8
-
9
-
10
-
11
-
12
-
13
-
14
-
15
-
16
-
17
-
18
-
19
-
20
-
21
-
22
-
23
-
24
-
25
-
26
-
27
-
28
-
29
-
30
-
31
-
32
-
33
-
34
-
35
-
36
-
37
-
38
-
39
-
40
-
41
-
42
-
43
-
44
-
45
-
46
-
47
-
48
-
49
-
50
-
51
-
52
-
53
-
54
-
55
-
56
-
57
-
58
-
59
-
60
-
61
-
62
-
63
-
64
-
65
-
66
-
67
-
68
-
69
-
70
-
71
-
72
-
73
-
74
-
75
-
76
-
77
-
78
-
79
-
80
-
81
-
82
-
83
-
84
-
85
-
86
-
87
-
88
-
89
-
90
-
91
-
92
-
93
-
94
-
95
-
 96
96 -
 97
97 -
 98
98 -
 99
99 -
 100
100 -
 101
101 -
 102
102 -
 103
103 -
 104
104 -
 105
105 -
 106
106 -
 107
107 -
 108
108 -
 109
109 -
 110
110 -
 111
111 -
 112
112 -
 113
113 -
 114
114 -
 115
115 -
 116
116 -
117
-
118
-
119
-
120
-
121
-
122
-
123
-
124
-
125
-
126
-
127
-
128
-
129
-
130
-
131
-
132
-
133
-
134
-
135
-
136
-
137
-
138
-
139
-
140
-
141
-
142
-
143
-
144
-
145
-
146
-
147
-
148
-
149
-
150
-
151
-
152
-
153
-
154
-
155
-
156
-
157
-
158
-
159
-
160
-
161
-
162
-
163
-
164
-
165
-
166
-
167
-
168
-
169
-
170
-
171
-
172
-
173
-
174
-
175
-
176
-
177
-
178
-
179
-
180
-
181
-
182
-
183
-
184
-
185
-
186
-
187
-
188
-
189
-
190
-
191
-
192
-
193
-
194
-
195
-
196
-
197
-
198
-
199
-
200
-
201
-
202
-
203
-
204
-
205
-
206
-
207
-
208
-
209
-
210
-
211
-
212
-
213
-
214
-
215
-
216
-
217
-
218
-
219
-
220
-
221
-
222
-
223
-
224
-
225
-
226
-
227
-
228
-
229
-
230
-
231
-
232
 |
 |

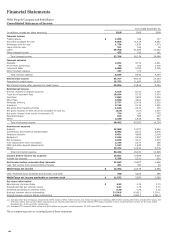
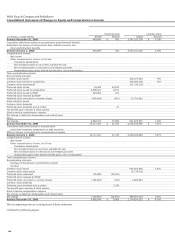
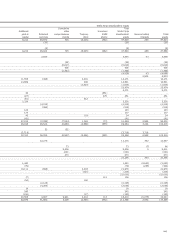
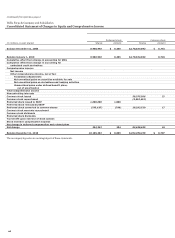
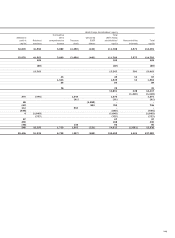
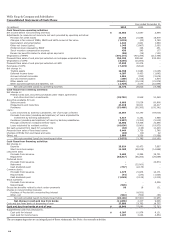
Financial Statements
Wells Fargo & Company and Subsidiaries
Consolidated Statement of Income
Year ended December 31,
(in millions, except per share amounts) 2010
2009
2008
Interest income
Trading assets $ 1,098
918
177
Securities available for sale 9,666
11,319
5,287
Mortgages held for sale 1,736
1,930
1,573
Loans held for sale 101
183
48
Loans 39,760
41,589
27,632
Other interest income 435
335
181
Total interest income 52,796
56,274
34,898
Interest expense
Deposits 2,832
3,774
4,521
Short-term borrowings 92
222
1,478
Long-term debt 4,888
5,782
3,756
Other interest expense 227
172
-
Total interest expense 8,039
9,950
9,755
Net interest income 44,757
46,324
25,143
Provision for credit losses 15,753
21,668
15,979
Net interest income after provision for credit losses 29,004
24,656
9,164
Noninterest income
Service charges on deposit accounts 4,916
5,741
3,190
Trust and investment fees 10,934
9,735
2,924
Card fees 3,652
3,683
2,336
Other fees 3,990
3,804
2,097
Mortgage banking 9,737
12,028
2,525
Insurance 2,126
2,126
1,830
Net gains from trading activities 1,648
2,674
275
Net gains (losses) on debt securities available for sale (1) (324)
(127)
1,037
Net gains (losses) from equity investments (2) 779
185
(757)
Operating leases 815
685
427
Other 2,180
1,828
850
Total noninterest income 40,453
42,362
16,734
Noninterest expense
Salaries 13,869
13,757
8,260
Commission and incentive compensation 8,692
8,021
2,676
Employee benefits 4,651
4,689
2,004
Equipment 2,636
2,506
1,357
Net occupancy 3,030
3,127
1,619
Core deposit and other intangibles 2,199
2,577
186
FDIC and other deposit assessments 1,197
1,849
120
Other 14,182
12,494
6,376
Total noninterest expense 50,456
49,020
22,598
Income before income tax expense 19,001
17,998
3,300
Income tax expense 6,338
5,331
602
Net income before noncontrolling interests 12,663
12,667
2,698
Less: Net income from noncontrolling interests 301
392
43
Wells Fargo net income $ 12,362
12,275
2,655
Less: Preferred stock dividends and accretion and other 730
4,285
286
Wells Fargo net income applicable to common stock $ 11,632
7,990
2,369
Per share information
Earnings per common share $ 2.23
1.76
0.70
Diluted earnings per common share 2.21
1.75
0.70
Dividends declared per common share 0.20
0.49
1.30
Average common shares outstanding 5,226.8
4,545.2
3,378.1
Diluted average common shares outstanding 5,263.1
4,562.7
3,391.3
(1) Includes other-than-temporary impairment (OTTI) losses of $672 million and $1,012 million recognized in earnings ($500 million and $2,352 million of total OTTI losses, net
of $(172) million and $1,340 million recognized as an increase (decrease) to non-credit related OTTI losses recorded in other comprehensive income) for the year ended
December 31, 2010 and 2009, respectively.
(2) Includes OTTI losses of $268 million and $655 million for the year ended December 31, 2010 and 2009, respectively.
The accompanying notes are an integral part of these statements.
104