Wells Fargo 2010 Annual Report Download - page 112
Download and view the complete annual report
Please find page 112 of the 2010 Wells Fargo annual report below. You can navigate through the pages in the report by either clicking on the pages listed below, or by using the keyword search tool below to find specific information within the annual report.-
 1
1 -
2
-
3
-
4
-
5
-
6
-
7
-
8
-
9
-
10
-
11
-
12
-
13
-
14
-
15
-
16
-
17
-
18
-
19
-
20
-
21
-
22
-
23
-
24
-
25
-
26
-
27
-
28
-
29
-
30
-
31
-
32
-
33
-
34
-
35
-
36
-
37
-
38
-
39
-
40
-
41
-
42
-
43
-
44
-
45
-
46
-
47
-
48
-
49
-
50
-
51
-
52
-
53
-
54
-
55
-
56
-
57
-
58
-
59
-
60
-
61
-
62
-
63
-
64
-
65
-
66
-
67
-
68
-
69
-
70
-
71
-
72
-
73
-
74
-
75
-
76
-
77
-
78
-
79
-
80
-
81
-
82
-
83
-
84
-
85
-
86
-
87
-
88
-
89
-
90
-
91
-
92
-
93
-
94
-
95
-
96
-
97
-
98
-
99
-
100
-
101
-
 102
102 -
 103
103 -
 104
104 -
 105
105 -
 106
106 -
 107
107 -
 108
108 -
 109
109 -
 110
110 -
 111
111 -
 112
112 -
 113
113 -
 114
114 -
 115
115 -
 116
116 -
 117
117 -
 118
118 -
 119
119 -
 120
120 -
 121
121 -
 122
122 -
123
-
124
-
125
-
126
-
127
-
128
-
129
-
130
-
131
-
132
-
133
-
134
-
135
-
136
-
137
-
138
-
139
-
140
-
141
-
142
-
143
-
144
-
145
-
146
-
147
-
148
-
149
-
150
-
151
-
152
-
153
-
154
-
155
-
156
-
157
-
158
-
159
-
160
-
161
-
162
-
163
-
164
-
165
-
166
-
167
-
168
-
169
-
170
-
171
-
172
-
173
-
174
-
175
-
176
-
177
-
178
-
179
-
180
-
181
-
182
-
183
-
184
-
185
-
186
-
187
-
188
-
189
-
190
-
191
-
192
-
193
-
194
-
195
-
196
-
197
-
198
-
199
-
200
-
201
-
202
-
203
-
204
-
205
-
206
-
207
-
208
-
209
-
210
-
211
-
212
-
213
-
214
-
215
-
216
-
217
-
218
-
219
-
220
-
221
-
222
-
223
-
224
-
225
-
226
-
227
-
228
-
229
-
230
-
231
-
232
 |
 |

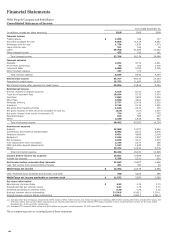
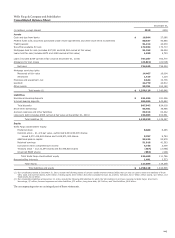
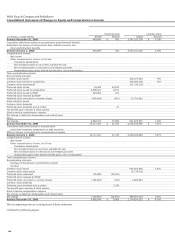
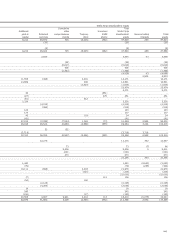
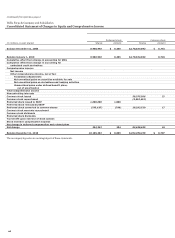
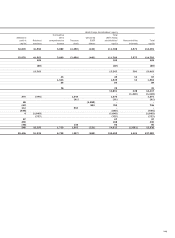
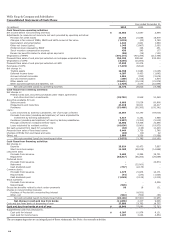
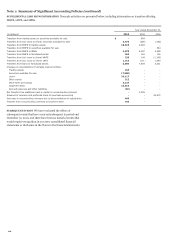
Wells Fargo & Company and Subsidiaries
Consolidated Statement of Cash Flows
Year ended December 31,
(in millions)
2010
2009
2008
Cash flows from operating activities:
Net income before noncontrolling interests $
12,663
12,667
2,698
Adjustments to reconcile net income to net cash provided by operating activities:
Provision for credit losses 15,753
21,668
15,979
Changes in fair value of MSRs, MHFS and LHFS carried at fair value (1,025)
(20)
3,789
Depreciation and amortization 1,924
2,841
1,669
Other net losses (gains) 1,345
(3,867)
2,065
Preferred stock released by ESOP 796
106
451
Stock incentive compensation expense 436
245
177
Excess tax benefits related to stock option payments (98)
(18)
(121)
Originations of MHFS (370,175)
(414,299)
(213,498)
Proceeds from sales of and principal collected on mortgages originated for sale
355,325
399,261
220,254
Originations of LHFS (4,596)
(10,800)
-
Proceeds from sales of and principal collected on LHFS 17,828
20,276
-
Purchases of LHFS (7,470)
(8,614)
-
Net change in:
Trading assets 12,356
13,983
(3,045)
Deferred income taxes 4,287
9,453
(1,642)
Accrued interest receivable 1,051
(293)
(2,676)
Accrued interest payable (268)
(1,028)
1,634
Other assets, net (19,631)
(15,018)
(21,578)
Other accrued expenses and liabilities, net (1,729)
2,070
(10,944)
Net cash provided (used) by operating activities 18,772
28,613
(4,788)
Cash flows from investing activities:
Net change in:
Federal funds sold, securities purchased under resale agreements
and other short-term investments (39,752)
8,548
51,049
Securities available for sale:
Sales proceeds 8,668
53,038
60,806
Prepayments and maturities 47,919
38,811
24,317
Purchases (53,466)
(95,285)
(105,341)
Loans:
Loans originated by banking subsidiaries, net of principal collected 15,869
52,240
(54,815)
Proceeds from sales (including participations) of loans originated for
investment by banking subsidiaries 6,517
6,162
1,988
Purchases (including participations) of loans by banking subsidiaries (2,297)
(3,363)
(5,513)
Principal collected on nonbank entities’ loans 15,560
14,428
21,846
Loans originated by nonbank entities (10,836)
(9,961)
(19,973)
Net cash acquired from (paid for) acquisitions (36)
(138)
11,203
Proceeds from sales of foreclosed assets 5,444
3,759
1,746
Changes in MSRs from purchases and sales (65)
(10)
92
Other, net 2,800
3,556
(5,566)
Net cash provided (used) by investing activities (3,675)
71,785
(18,161)
Cash flows from financing activities:
Net change in:
Deposits 23,924
42,473
7,697
Short-term borrowings 11,308
(69,108)
(14,888)
Long-term debt:
Proceeds from issuance 3,489
8,396
35,701
Repayment (63,317)
(66,260)
(29,859)
Preferred stock:
Proceeds from issuance -
-
22,674
Redeemed -
(25,000)
-
Cash dividends paid (737)
(2,178)
-
Common stock:
Proceeds from issuance 1,375
21,976
14,171
Repurchased (91)
(220)
(1,623)
Cash dividends paid (1,045)
(2,125)
(4,312)
Stock warrants:
Proceeds from issuance -
-
2,326
Repurchased (545)
-
-
Excess tax benefits related to stock option payments 98
18
121
Change in noncontrolling interests:
Purchase of Prudential's noncontrolling interest
-
(4,500)
-
Other, net
(592)
(553)
(53)
Net cash provided (used) by financing activities (26,133)
(97,081)
31,955
Net change in cash and due from banks (11,036)
3,317
9,006
Cash and due from banks at beginning of year 27,080
23,763
14,757
Cash and due from banks at end of year $
16,044
27,080
23,763
Supplemental cash flow disclosures:
Cash paid for interest $
8,307
10,978
8,121
Cash paid for income taxes 1,187
3,042
2,554
The accompanying notes are an integral part of these statements. See Note 1 for noncash activities.
110