Wells Fargo 2010 Annual Report Download - page 162
Download and view the complete annual report
Please find page 162 of the 2010 Wells Fargo annual report below. You can navigate through the pages in the report by either clicking on the pages listed below, or by using the keyword search tool below to find specific information within the annual report.-
 1
1 -
2
-
3
-
4
-
5
-
6
-
7
-
8
-
9
-
10
-
11
-
12
-
13
-
14
-
15
-
16
-
17
-
18
-
19
-
20
-
21
-
22
-
23
-
24
-
25
-
26
-
27
-
28
-
29
-
30
-
31
-
32
-
33
-
34
-
35
-
36
-
37
-
38
-
39
-
40
-
41
-
42
-
43
-
44
-
45
-
46
-
47
-
48
-
49
-
50
-
51
-
52
-
53
-
54
-
55
-
56
-
57
-
58
-
59
-
60
-
61
-
62
-
63
-
64
-
65
-
66
-
67
-
68
-
69
-
70
-
71
-
72
-
73
-
74
-
75
-
76
-
77
-
78
-
79
-
80
-
81
-
82
-
83
-
84
-
85
-
86
-
87
-
88
-
89
-
90
-
91
-
92
-
93
-
94
-
95
-
96
-
97
-
98
-
99
-
100
-
101
-
102
-
103
-
104
-
105
-
106
-
107
-
108
-
109
-
110
-
111
-
112
-
113
-
114
-
115
-
116
-
117
-
118
-
119
-
120
-
121
-
122
-
123
-
124
-
125
-
126
-
127
-
128
-
129
-
130
-
131
-
132
-
133
-
134
-
135
-
136
-
137
-
138
-
139
-
140
-
141
-
142
-
143
-
144
-
145
-
146
-
147
-
148
-
149
-
150
-
151
-
 152
152 -
 153
153 -
 154
154 -
 155
155 -
 156
156 -
 157
157 -
 158
158 -
 159
159 -
 160
160 -
 161
161 -
 162
162 -
 163
163 -
 164
164 -
 165
165 -
 166
166 -
 167
167 -
 168
168 -
 169
169 -
 170
170 -
 171
171 -
 172
172 -
173
-
174
-
175
-
176
-
177
-
178
-
179
-
180
-
181
-
182
-
183
-
184
-
185
-
186
-
187
-
188
-
189
-
190
-
191
-
192
-
193
-
194
-
195
-
196
-
197
-
198
-
199
-
200
-
201
-
202
-
203
-
204
-
205
-
206
-
207
-
208
-
209
-
210
-
211
-
212
-
213
-
214
-
215
-
216
-
217
-
218
-
219
-
220
-
221
-
222
-
223
-
224
-
225
-
226
-
227
-
228
-
229
-
230
-
231
-
232
 |
 |

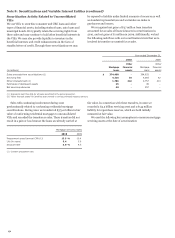
Note 10: Intangible Assets (continued)
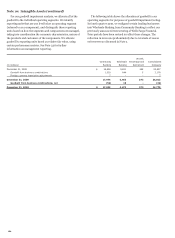
For our goodwill impairment analysis, we allocate all of the
goodwill to the individual operating segments. We identify
reporting units that are one level below an operating segment
(referred to as a component), and distinguish these reporting
units based on how the segments and components are managed,
taking into consideration the economic characteristics, nature of
the products and customers of the components. We allocate
goodwill to reporting units based on relative fair value, using
certain performance metrics. See Note 23 for further
information on management reporting.
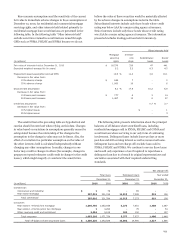
The following table shows the allocation of goodwill to our
operating segments for purposes of goodwill impairment testing.
In fourth quarter 2010, we realigned certain lending businesses
into Wholesale Banking from Community Banking to reflect our
previously announced restructuring of Wells Fargo Financial.
Prior periods have been revised to reflect these changes. The
reduction in 2010 was predominately due to reversals of excess
exit reserves as discussed in Note 2.
Wealth,
Community
Wholesale
Brokerage and
Consolidated
(in millions) Banking
Banking
Retirement
Company
December 31, 2008 $ 16,638
5,621
368
22,627
Goodwill from business combinations 1,329
844
5
2,178
Foreign currency translation adjustments 7
-
-
7
December 31, 2009 17,974
6,465
373
24,812
Goodwill from business combinations, net (52)
10
-
(42)
December 31, 2010 $ 17,922
6,475
373
24,770
160