Wells Fargo 2010 Annual Report Download - page 192
Download and view the complete annual report
Please find page 192 of the 2010 Wells Fargo annual report below. You can navigate through the pages in the report by either clicking on the pages listed below, or by using the keyword search tool below to find specific information within the annual report.-
 1
1 -
2
-
3
-
4
-
5
-
6
-
7
-
8
-
9
-
10
-
11
-
12
-
13
-
14
-
15
-
16
-
17
-
18
-
19
-
20
-
21
-
22
-
23
-
24
-
25
-
26
-
27
-
28
-
29
-
30
-
31
-
32
-
33
-
34
-
35
-
36
-
37
-
38
-
39
-
40
-
41
-
42
-
43
-
44
-
45
-
46
-
47
-
48
-
49
-
50
-
51
-
52
-
53
-
54
-
55
-
56
-
57
-
58
-
59
-
60
-
61
-
62
-
63
-
64
-
65
-
66
-
67
-
68
-
69
-
70
-
71
-
72
-
73
-
74
-
75
-
76
-
77
-
78
-
79
-
80
-
81
-
82
-
83
-
84
-
85
-
86
-
87
-
88
-
89
-
90
-
91
-
92
-
93
-
94
-
95
-
96
-
97
-
98
-
99
-
100
-
101
-
102
-
103
-
104
-
105
-
106
-
107
-
108
-
109
-
110
-
111
-
112
-
113
-
114
-
115
-
116
-
117
-
118
-
119
-
120
-
121
-
122
-
123
-
124
-
125
-
126
-
127
-
128
-
129
-
130
-
131
-
132
-
133
-
134
-
135
-
136
-
137
-
138
-
139
-
140
-
141
-
142
-
143
-
144
-
145
-
146
-
147
-
148
-
149
-
150
-
151
-
152
-
153
-
154
-
155
-
156
-
157
-
158
-
159
-
160
-
161
-
162
-
163
-
164
-
165
-
166
-
167
-
168
-
169
-
170
-
171
-
172
-
173
-
174
-
175
-
176
-
177
-
178
-
179
-
180
-
181
-
 182
182 -
 183
183 -
 184
184 -
 185
185 -
 186
186 -
 187
187 -
 188
188 -
 189
189 -
 190
190 -
 191
191 -
 192
192 -
 193
193 -
 194
194 -
 195
195 -
 196
196 -
 197
197 -
 198
198 -
 199
199 -
 200
200 -
 201
201 -
 202
202 -
203
-
204
-
205
-
206
-
207
-
208
-
209
-
210
-
211
-
212
-
213
-
214
-
215
-
216
-
217
-
218
-
219
-
220
-
221
-
222
-
223
-
224
-
225
-
226
-
227
-
228
-
229
-
230
-
231
-
232
 |
 |

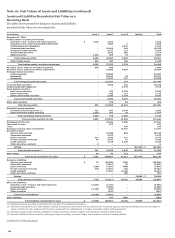
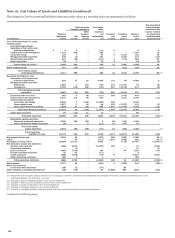
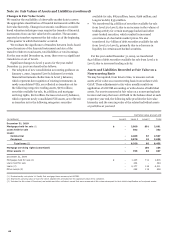
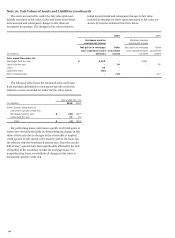
Note 16: Fair Values of Assets and Liabilities (continued)
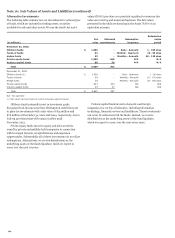
Alternative Investments
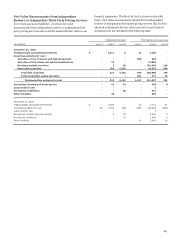
The following table summarizes our investments in various types
of funds, which are included in trading assets, securities
available for sale and other assets. We use the funds’ net asset
values (NAVs) per share as a practical expedient to measure fair
value on recurring and nonrecurring bases. The fair values
presented in the table are based upon the funds’ NAVs or an
equivalent measure.
Redemption
Fair
Unfunded
Redemption
notice
(in millions)
value
commitments
frequency
period
December 31, 2010
Offshore funds $ 1,665
-
Daily - Annually
1 - 180 days
Funds of funds 63
-
Monthly - Quarterly
10 - 90 days
Hedge funds 23
-
Monthly - Annually
30 - 120 days
Private equity funds 1,830
669
N/A
N/A
Venture capital funds 88
36
N/A
N/A
Total $ 3,669
705
December 31, 2009
Offshore funds (1) $ 1,559
-
Daily - Quarterly
1 - 90 days
Funds of funds 69
-
Monthly - Annually
10 - 120 days
Hedge funds 35
-
Monthly - Annually
30 - 180 days
Private equity funds 901
340
N/A
N/A
Venture capital funds 93
47
N/A
N/A
Total $ 2,657
387
N/A - Not applicable
(1) “Fair value” has been revised to correct previously reported amount.
Offshore funds primarily invest in investment grade
European fixed-income securities. Redemption restrictions are
in place for investments with a fair value of $74 million and
$76 million at December 31, 2010 and 2009, respectively, due to
lock-up provisions that will remain in effect until
November 2012.
Private equity funds invest in equity and debt securities
issued by private and publicly-held companies in connection
with leveraged buyouts, recapitalizations and expansion
opportunities. Substantially all of these investments do not allow
redemptions. Alternatively, we receive distributions as the
underlying assets of the funds liquidate, which we expect to
occur over the next 10 years.
Venture capital funds invest in domestic and foreign
companies in a variety of industries, including information
technology, financial services and healthcare. These investments
can never be redeemed with the funds. Instead, we receive
distributions as the underlying assets of the fund liquidate,
which we expect to occur over the next seven years.
190