Wells Fargo 2010 Annual Report Download - page 108
Download and view the complete annual report
Please find page 108 of the 2010 Wells Fargo annual report below. You can navigate through the pages in the report by either clicking on the pages listed below, or by using the keyword search tool below to find specific information within the annual report.-
 1
1 -
2
-
3
-
4
-
5
-
6
-
7
-
8
-
9
-
10
-
11
-
12
-
13
-
14
-
15
-
16
-
17
-
18
-
19
-
20
-
21
-
22
-
23
-
24
-
25
-
26
-
27
-
28
-
29
-
30
-
31
-
32
-
33
-
34
-
35
-
36
-
37
-
38
-
39
-
40
-
41
-
42
-
43
-
44
-
45
-
46
-
47
-
48
-
49
-
50
-
51
-
52
-
53
-
54
-
55
-
56
-
57
-
58
-
59
-
60
-
61
-
62
-
63
-
64
-
65
-
66
-
67
-
68
-
69
-
70
-
71
-
72
-
73
-
74
-
75
-
76
-
77
-
78
-
79
-
80
-
81
-
82
-
83
-
84
-
85
-
86
-
87
-
88
-
89
-
90
-
91
-
92
-
93
-
94
-
95
-
96
-
97
-
 98
98 -
 99
99 -
 100
100 -
 101
101 -
 102
102 -
 103
103 -
 104
104 -
 105
105 -
 106
106 -
 107
107 -
 108
108 -
 109
109 -
 110
110 -
 111
111 -
 112
112 -
 113
113 -
 114
114 -
 115
115 -
 116
116 -
 117
117 -
 118
118 -
119
-
120
-
121
-
122
-
123
-
124
-
125
-
126
-
127
-
128
-
129
-
130
-
131
-
132
-
133
-
134
-
135
-
136
-
137
-
138
-
139
-
140
-
141
-
142
-
143
-
144
-
145
-
146
-
147
-
148
-
149
-
150
-
151
-
152
-
153
-
154
-
155
-
156
-
157
-
158
-
159
-
160
-
161
-
162
-
163
-
164
-
165
-
166
-
167
-
168
-
169
-
170
-
171
-
172
-
173
-
174
-
175
-
176
-
177
-
178
-
179
-
180
-
181
-
182
-
183
-
184
-
185
-
186
-
187
-
188
-
189
-
190
-
191
-
192
-
193
-
194
-
195
-
196
-
197
-
198
-
199
-
200
-
201
-
202
-
203
-
204
-
205
-
206
-
207
-
208
-
209
-
210
-
211
-
212
-
213
-
214
-
215
-
216
-
217
-
218
-
219
-
220
-
221
-
222
-
223
-
224
-
225
-
226
-
227
-
228
-
229
-
230
-
231
-
232
 |
 |

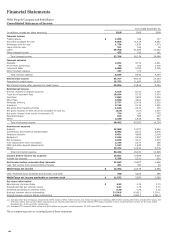
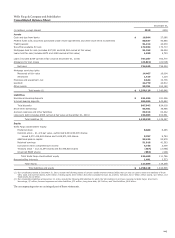
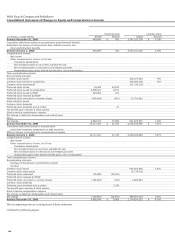
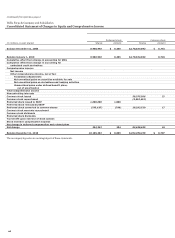
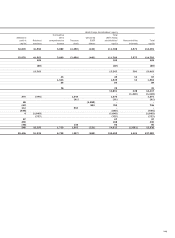
Wells Fargo & Company and Subsidiaries
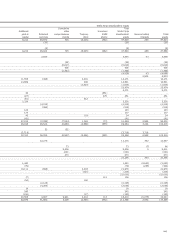
Consolidated Statement of Changes in Equity and Comprehensive Income
Preferred stock
Common stock
(in millions, except shares) Shares
Amount
Shares
Amount
Balance December 31, 2007 449,804
$ 450
3,297,102,208
$ 5,788
Cumulative effect from change in accounting for postretirement benefits
Adjustment for change of measurement date related to pension and
other postretirement benefits
Balance January 1, 2008 449,804
450
3,297,102,208
5,788
Comprehensive income:
Net income
Other comprehensive income, net of tax:
Translation adjustments
Net unrealized losses on securities available for sale
Net unrealized gains on derivatives and hedging activities
Unamortized losses under defined benefit plans, net of amortization
Total comprehensive income
Noncontrolling interests
Common stock issued 538,877,525
781
Common stock issued for acquisitions 429,084,786
704
Common stock repurchased (52,154,513)
Preferred stock issued 25,000
22,674
Preferred stock issued for acquisitions 9,566,921
8,071
Preferred stock issued to ESOP 520,500
521
Preferred stock released by ESOP
Preferred stock converted to common shares (450,404)
(451)
15,720,883
Stock warrants issued
Common stock dividends
Preferred stock dividends and accretion 67
Tax benefit upon exercise of stock options
Stock incentive compensation expense
Net change in deferred compensation and related plans
Other
Net change 9,662,017
30,882
931,528,681
1,485
Balance December 31, 2008 10,111,821
$ 31,332
4,228,630,889
$ 7,273
Cumulative effect from change in accounting for
other-than-temporary impairment on debt securities
Effect of change in accounting for noncontrolling interests
Balance January 1, 2009 10,111,821
31,332
4,228,630,889
7,273
Comprehensive income:
Net income
Other comprehensive income, net of tax:
Translation adjustments
Net unrealized gains on securities available for sale
Net unrealized losses on derivatives and hedging activities
Unamortized gains under defined benefit plans, net of amortization
Total comprehensive income
Noncontrolling interests:
Purchase of Prudential’s noncontrolling interest
All other
Common stock issued 953,285,636
1,470
Common stock repurchased (8,274,015)
Preferred stock redeemed (25,000)
(25,000)
Preferred stock released by ESOP
Preferred stock converted to common shares (105,881)
(106)
4,982,083
Common stock dividends
Preferred stock dividends and accretion 2,259
Tax benefit upon exercise of stock options
Stock incentive compensation expense
Net change in deferred compensation and related plans
Net change (130,881)
(22,847)
949,993,704
1,470
Balance December 31, 2009 9,980,940
$ 8,485
5,178,624,593
$ 8,743
The accompanying notes are an integral part of these statements.
(continued on following pages)
106