Wells Fargo 2010 Annual Report Download - page 63
Download and view the complete annual report
Please find page 63 of the 2010 Wells Fargo annual report below. You can navigate through the pages in the report by either clicking on the pages listed below, or by using the keyword search tool below to find specific information within the annual report.-
 1
1 -
2
-
3
-
4
-
5
-
6
-
7
-
8
-
9
-
10
-
11
-
12
-
13
-
14
-
15
-
16
-
17
-
18
-
19
-
20
-
21
-
22
-
23
-
24
-
25
-
26
-
27
-
28
-
29
-
30
-
31
-
32
-
33
-
34
-
35
-
36
-
37
-
38
-
39
-
40
-
41
-
42
-
43
-
44
-
45
-
46
-
47
-
48
-
49
-
50
-
51
-
52
-
 53
53 -
 54
54 -
 55
55 -
 56
56 -
 57
57 -
 58
58 -
 59
59 -
 60
60 -
 61
61 -
 62
62 -
 63
63 -
 64
64 -
 65
65 -
 66
66 -
 67
67 -
 68
68 -
 69
69 -
 70
70 -
 71
71 -
 72
72 -
 73
73 -
74
-
75
-
76
-
77
-
78
-
79
-
80
-
81
-
82
-
83
-
84
-
85
-
86
-
87
-
88
-
89
-
90
-
91
-
92
-
93
-
94
-
95
-
96
-
97
-
98
-
99
-
100
-
101
-
102
-
103
-
104
-
105
-
106
-
107
-
108
-
109
-
110
-
111
-
112
-
113
-
114
-
115
-
116
-
117
-
118
-
119
-
120
-
121
-
122
-
123
-
124
-
125
-
126
-
127
-
128
-
129
-
130
-
131
-
132
-
133
-
134
-
135
-
136
-
137
-
138
-
139
-
140
-
141
-
142
-
143
-
144
-
145
-
146
-
147
-
148
-
149
-
150
-
151
-
152
-
153
-
154
-
155
-
156
-
157
-
158
-
159
-
160
-
161
-
162
-
163
-
164
-
165
-
166
-
167
-
168
-
169
-
170
-
171
-
172
-
173
-
174
-
175
-
176
-
177
-
178
-
179
-
180
-
181
-
182
-
183
-
184
-
185
-
186
-
187
-
188
-
189
-
190
-
191
-
192
-
193
-
194
-
195
-
196
-
197
-
198
-
199
-
200
-
201
-
202
-
203
-
204
-
205
-
206
-
207
-
208
-
209
-
210
-
211
-
212
-
213
-
214
-
215
-
216
-
217
-
218
-
219
-
220
-
221
-
222
-
223
-
224
-
225
-
226
-
227
-
228
-
229
-
230
-
231
-
232
 |
 |

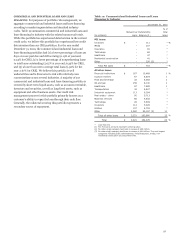
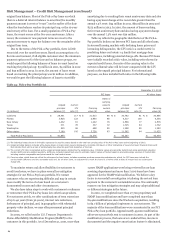
PICK-A-PAY PORTFOLIO The Pick-a-Pay portfolio was one of
the consumer residential first mortgage portfolios we acquired
from Wachovia. We considered a majority of the Pick-a-Pay
loans to be PCI loans.
The Pick-a-Pay portfolio had an outstanding balance of
$84.2 billion and a carrying value of $74.8 billion at
December 31, 2010. It is a liquidating portfolio, as Wachovia
ceased originating new Pick-a-Pay loans in 2008.
Real estate 1-4 family junior lien mortgages and lines of
credit associated with Pick-a-Pay loans are reported in the Home
Equity core portfolio. The Pick-a-Pay portfolio includes loans
that offer payment options (Pick-a-Pay option payment loans),
loans that were originated without the option payment feature,
loans that no longer offer the option feature as a result of our
modification efforts since the acquisition, and loans where the
customer voluntarily converted to a fixed-rate product. The Pick-
a-Pay portfolio is included in the consumer real estate 1-4 family
first mortgage class of loans in Note 6 (Loans and Allowance for
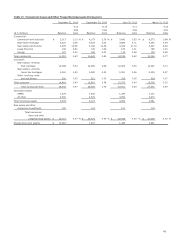
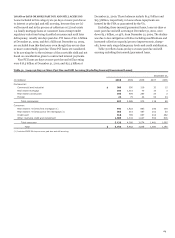
Credit Losses) to Financial Statements in this Report. Table 23
provides balances over time related to the types of loans
included in the portfolio.
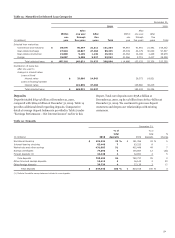
Table 23: Pick-a-Pay Portfolio - Balances Over Time
December 31,
2010
2009
2008
Unpaid
Unpaid
Unpaid
principal
principal
principal
(in millions) balance
% of total
balance
% of total
balance
% of total
Option payment loans (1) $ 49,958
59
%
$ 67,170
69
% $ 99,937
86
%
Non-option payment adjustable-rate
and fixed-rate loans (1) 11,070
13
13,926
14
15,763
14
Full-term loan modifications (1) 23,132
28
16,378
17
-
-
Total unpaid principal balance (1) $ 84,160
100
%
$ 97,474
100
% $ 115,700
100
%
Total carrying value $ 74,815
$ 85,238
$ 95,315
(1)
Unpaid principal balance includes write-downs taken on loans where severe delinquency (normally 180 days) or other indications of severe borrower financial stress exist
that indicate there will be a loss of contractually due amounts upon final resolution of the loan.
PCI loans in the Pick-a-Pay portfolio had an outstanding
balance of $41.9 billion and a carrying value of $32.4 billion at
December 31, 2010. The carrying value of the PCI loans is net of
remaining purchase accounting write-downs, which reflected
their fair value at acquisition. Upon acquisition, we recorded a
$22.4 billion write-down in purchase accounting on Pick-a-Pay
loans that were impaired.
Due to the sustained positive performance observed on the
Pick-a-Pay portfolio compared to the original acquisition
estimates, we have reclassified $2.4 billion from the
nonaccretable difference to the accretable yield since the
Wachovia merger. This improvement in the lifetime credit
outlook for this portfolio is primarily attributable to the
significant modification efforts as well as the portfolio’s
delinquency stabilization. This improvement in the credit
outlook is expected to be realized over the remaining life of the
portfolio, which is estimated to have a weighted-average life of
approximately nine years. The accretable yield percentage at the
end of 2010 was 4.54% compared with 5.34% at the end of 2009.
Fluctuations in the accretable yield are driven by changes in
interest rate indices for variable rate PCI loans, prepayment
assumptions, and expected principal and interest payments over
the estimated life of the portfolio. Changes in the projected
timing of cash flow events, including loan liquidations,
modifications and short sales, can also affect the accretable yield
percentage and the estimated weighted-average life of the
portfolio.
Pick-a-Pay option payment loans may be adjustable or fixed
rate. They are home mortgages on which the customer has the
option each month to select from among four payment options:
(1) a minimum payment as described below, (2) an interest-only
payment, (3) a fully amortizing 15-year payment, or (4) a fully
amortizing 30-year payment.
The minimum monthly payment for substantially all of our
Pick-a-Pay loans is reset annually. The new minimum monthly
payment amount usually cannot increase by more than 7.5% of
the then-existing principal and interest payment amount. The
minimum payment may not be sufficient to pay the monthly
interest due and in those situations a loan on which the
customer has made a minimum payment is subject to “negative
amortization,” where unpaid interest is added to the principal
balance of the loan. The amount of interest that has been added
to a loan balance is referred to as “deferred interest.” Total
deferred interest of $2.7 billion at December 31, 2010, was down
from $3.7 billion at December 31, 2009, due to loan modification
efforts as well as falling interest rates resulting in the minimum
payment option covering the interest and some principal on
many loans. At December 31, 2010, approximately 75% of
customers choosing the minimum payment option did not defer
interest.
Deferral of interest on a Pick-a-Pay loan may continue as
long as the loan balance remains below a pre-defined principal
cap, which is based on the percentage that the current loan
balance represents to the original loan balance. Loans with an
original loan-to-value (LTV) ratio equal to or below 85% have a
cap of 125% of the original loan balance, and these loans
represent substantially all the Pick-a-Pay portfolio. Loans with
an original LTV ratio above 85% have a cap of 110% of the
61