Wells Fargo 2010 Annual Report Download - page 156
Download and view the complete annual report
Please find page 156 of the 2010 Wells Fargo annual report below. You can navigate through the pages in the report by either clicking on the pages listed below, or by using the keyword search tool below to find specific information within the annual report.-
 1
1 -
2
-
3
-
4
-
5
-
6
-
7
-
8
-
9
-
10
-
11
-
12
-
13
-
14
-
15
-
16
-
17
-
18
-
19
-
20
-
21
-
22
-
23
-
24
-
25
-
26
-
27
-
28
-
29
-
30
-
31
-
32
-
33
-
34
-
35
-
36
-
37
-
38
-
39
-
40
-
41
-
42
-
43
-
44
-
45
-
46
-
47
-
48
-
49
-
50
-
51
-
52
-
53
-
54
-
55
-
56
-
57
-
58
-
59
-
60
-
61
-
62
-
63
-
64
-
65
-
66
-
67
-
68
-
69
-
70
-
71
-
72
-
73
-
74
-
75
-
76
-
77
-
78
-
79
-
80
-
81
-
82
-
83
-
84
-
85
-
86
-
87
-
88
-
89
-
90
-
91
-
92
-
93
-
94
-
95
-
96
-
97
-
98
-
99
-
100
-
101
-
102
-
103
-
104
-
105
-
106
-
107
-
108
-
109
-
110
-
111
-
112
-
113
-
114
-
115
-
116
-
117
-
118
-
119
-
120
-
121
-
122
-
123
-
124
-
125
-
126
-
127
-
128
-
129
-
130
-
131
-
132
-
133
-
134
-
135
-
136
-
137
-
138
-
139
-
140
-
141
-
142
-
143
-
144
-
145
-
 146
146 -
 147
147 -
 148
148 -
 149
149 -
 150
150 -
 151
151 -
 152
152 -
 153
153 -
 154
154 -
 155
155 -
 156
156 -
 157
157 -
 158
158 -
 159
159 -
 160
160 -
 161
161 -
 162
162 -
 163
163 -
 164
164 -
 165
165 -
 166
166 -
167
-
168
-
169
-
170
-
171
-
172
-
173
-
174
-
175
-
176
-
177
-
178
-
179
-
180
-
181
-
182
-
183
-
184
-
185
-
186
-
187
-
188
-
189
-
190
-
191
-
192
-
193
-
194
-
195
-
196
-
197
-
198
-
199
-
200
-
201
-
202
-
203
-
204
-
205
-
206
-
207
-
208
-
209
-
210
-
211
-
212
-
213
-
214
-
215
-
216
-
217
-
218
-
219
-
220
-
221
-
222
-
223
-
224
-
225
-
226
-
227
-
228
-
229
-
230
-
231
-
232
 |
 |

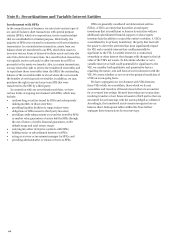
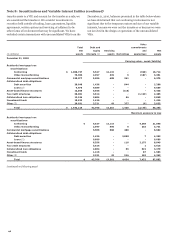
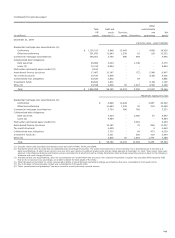
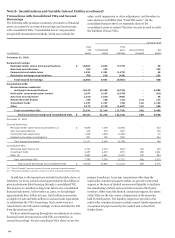
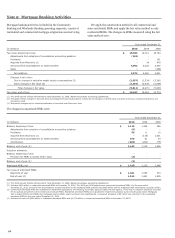
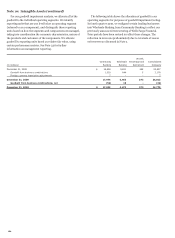
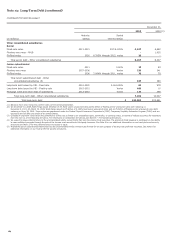
Note 8: Securitizations and Variable Interest Entities (continued)
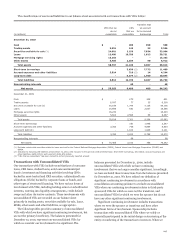
Transactions with Consolidated VIEs and Secured
Borrowings
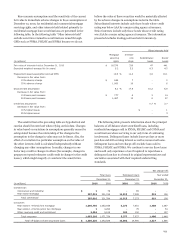
The following table presents a summary of transfers of financial
assets accounted for as secured borrowings and involvements
with consolidated VIEs. “Consolidated assets” are presented
using GAAP measurement methods, which may include fair
value, credit impairment or other adjustments, and therefore in
some instances will differ from “Total VIE assets.” On the
consolidated balance sheet, we separately disclose the
consolidated assets of certain VIEs that can only be used to settle
the liabilities of those VIEs.
Carrying value
Total
Third
VIE
Consolidated
party
Noncontrolling
Net
(in millions)
assets
assets
liabilities
interests
assets
December 31, 2010
Secured borrowings:
Municipal tender option bond securitizations $
10,687
7,874
(7,779)
-
95
Auto loan securitizations 154
154
-
-
154
Commercial real estate loans 1,321
1,321
(1,272)
-
49
Residential mortgage securitizations 700
618
(436)
-
182
Total secured borrowings 12,862
9,967
(9,487)
-
480
Consolidated VIEs:
Nonconforming residential
mortgage loan securitizations 14,518
13,529
(6,723)
-
6,806
Multi-seller commercial paper conduit 3,197
3,197
(3,279)
-
(82)
Auto loan securitizations 1,010
1,010
(955)
-
55
Structured asset finance 146
146
(21)
(11)
114
Investment funds 1,197
1,197
(54)
(14)
1,129
Other 2,173
2,170
(1,697)
(15)
458
Total consolidated VIEs 22,241
21,249
(12,729)
(40)
8,480
Total secured borrowings and consolidated VIEs $
35,103
31,216
(22,216)
(40)
8,960
December 31, 2009
Secured borrowings:
Municipal tender option bond securitizations (1) $ 9,649
7,189
(6,856)
-
333
Auto loan securitizations 274
274
(121)
-
153
Commercial real estate loans 1,309
1,309
(1,269)
-
40
Residential mortgage securitizations
901
792
(552)
-
240
Total secured borrowings
12,133
9,564
(8,798)
-
766
Consolidated VIEs:
Structured asset finance (2)
2,791
1,074
(919)
(10)
145
Investment funds
2,257
2,245
(271)
(33)
1,941
Other (2)
2,697
1,981
(1,032)
(25)
924
Total consolidated VIEs
7,745
5,300
(2,222)
(68)
3,010
Total secured borrowings and consolidated VIEs $ 19,878
14,864
(11,020)
(68)
3,776
(1) “Total VIE assets” has been revised to correct previously reported amount.
(2) “Third party liabilities” has been revised to correct previously reported amounts.
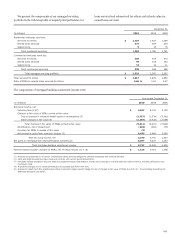
In addition to the transactions included in the table above, at
December 31, 2010, we had issued approximately $6.0 billion of
private placement debt financing through a consolidated VIE.
The issuance is classified as long-term debt in our consolidated
financial statements. At December 31, 2010, we had pledged
approximately $6.0 billion in loans, $478 million in securities
available for sale and $180 million in cash and cash equivalents
to collateralize the VIE’s borrowings. Such assets were not
transferred to the VIE and accordingly we have excluded the VIE
from the previous table.
We have raised financing through the securitization of certain
financial assets in transactions with VIEs accounted for as
secured borrowings. We also consolidate VIEs where we are the
primary beneficiary. In certain transactions other than the
multi-seller commercial paper conduit, we provide contractual
support in the form of limited recourse and liquidity to facilitate
the remarketing of short-term securities issued to third party
investors. Other than this limited contractual support, the assets
of the VIEs are the sole source of repayment of the securities
held by third parties. The liquidity support we provide to the
multi-seller commercial paper conduit ensures timely repayment
of commercial paper issued by the conduit and is described
further below.
154