Wells Fargo 2010 Annual Report Download - page 220
Download and view the complete annual report
Please find page 220 of the 2010 Wells Fargo annual report below. You can navigate through the pages in the report by either clicking on the pages listed below, or by using the keyword search tool below to find specific information within the annual report.-
 1
1 -
2
-
3
-
4
-
5
-
6
-
7
-
8
-
9
-
10
-
11
-
12
-
13
-
14
-
15
-
16
-
17
-
18
-
19
-
20
-
21
-
22
-
23
-
24
-
25
-
26
-
27
-
28
-
29
-
30
-
31
-
32
-
33
-
34
-
35
-
36
-
37
-
38
-
39
-
40
-
41
-
42
-
43
-
44
-
45
-
46
-
47
-
48
-
49
-
50
-
51
-
52
-
53
-
54
-
55
-
56
-
57
-
58
-
59
-
60
-
61
-
62
-
63
-
64
-
65
-
66
-
67
-
68
-
69
-
70
-
71
-
72
-
73
-
74
-
75
-
76
-
77
-
78
-
79
-
80
-
81
-
82
-
83
-
84
-
85
-
86
-
87
-
88
-
89
-
90
-
91
-
92
-
93
-
94
-
95
-
96
-
97
-
98
-
99
-
100
-
101
-
102
-
103
-
104
-
105
-
106
-
107
-
108
-
109
-
110
-
111
-
112
-
113
-
114
-
115
-
116
-
117
-
118
-
119
-
120
-
121
-
122
-
123
-
124
-
125
-
126
-
127
-
128
-
129
-
130
-
131
-
132
-
133
-
134
-
135
-
136
-
137
-
138
-
139
-
140
-
141
-
142
-
143
-
144
-
145
-
146
-
147
-
148
-
149
-
150
-
151
-
152
-
153
-
154
-
155
-
156
-
157
-
158
-
159
-
160
-
161
-
162
-
163
-
164
-
165
-
166
-
167
-
168
-
169
-
170
-
171
-
172
-
173
-
174
-
175
-
176
-
177
-
178
-
179
-
180
-
181
-
182
-
183
-
184
-
185
-
186
-
187
-
188
-
189
-
190
-
191
-
192
-
193
-
194
-
195
-
196
-
197
-
198
-
199
-
200
-
201
-
202
-
203
-
204
-
205
-
206
-
207
-
208
-
209
-
 210
210 -
 211
211 -
 212
212 -
 213
213 -
 214
214 -
 215
215 -
 216
216 -
 217
217 -
 218
218 -
 219
219 -
 220
220 -
 221
221 -
 222
222 -
 223
223 -
 224
224 -
 225
225 -
 226
226 -
 227
227 -
 228
228 -
 229
229 -
 230
230 -
231
-
232
 |
 |

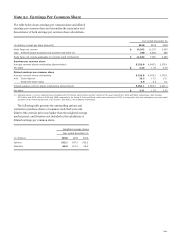
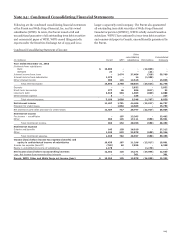
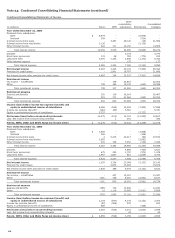
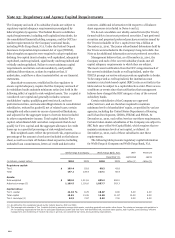
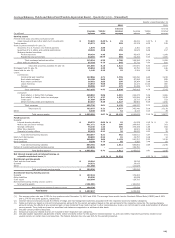
Note 24: Condensed Consolidated Financial Statements (continued)
Condensed Consolidating Statements of Cash Flows
Year ended December 31,
2010
2009
Other
Other
consolidating
consolidating
subsidiaries/
Consolidated
subsidiaries/
Consolidated
(in millions) Parent
WFFI
eliminations
Company
Parent
WFFI
eliminations
Company
Cash flows from operating activities:
Net cash provided
by operating activities $ 14,180
1,774
2,818
18,772
7,356
1,655
19,602
28,613
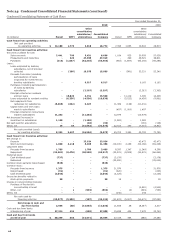
Cash flows from investing activities:
Securities available for sale:
Sales proceeds 2,441
796
5,431
8,668
1,184
925
50,929
53,038
Prepayments and maturities -
229
47,690
47,919
-
290
38,521
38,811
Purchases (119)
(1,037)
(52,310)
(53,466)
(463)
(1,667)
(93,155)
(95,285)
Loans:
Loans originated by banking
subsidiaries, net of principal
collected -
(206)
16,075
15,869
-
(981)
53,221
52,240
Proceeds from sales (including
participations) of loans
originated for investment by
banking subsidiaries -
-
6,517
6,517
-
-
6,162
6,162
Purchases (including participations)
of loans by banking
subsidiaries -
-
(2,297)
(2,297)
-
-
(3,363)
(3,363)
Principal collected on nonbank
entities' loans -
10,829
4,731
15,560
-
11,119
3,309
14,428
Loans originated by nonbank entities -
(6,336)
(4,500)
(10,836)
-
(5,523)
(4,438)
(9,961)
Net repayments from
(advances to) subsidiaries (5,485)
(842)
6,327
-
11,369
(138)
(11,231)
-
Capital notes and term loans
made to subsidiaries -
-
-
-
(497)
(1,000)
1,497
-
Principal collected on notes/loans
made to subsidiaries 11,282
-
(11,282)
-
12,979
-
(12,979)
-
Net decrease (increase) in
investment in subsidiaries 1,198
-
(1,198)
-
(1,382)
-
1,382
-
Net cash paid for acquisitions -
-
(36)
(36)
-
-
(138)
(138)
Other, net 15
64
(31,652)
(31,573)
22,513
355
(7,015)
15,853
Net cash provided (used)
by investing activities 9,332
3,497
(16,504)
(3,675)
45,703
3,380
22,702
71,785
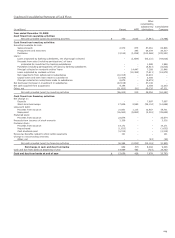
Cash flows from financing activities:
Net change in:
Deposits -
-
23,924
23,924
-
-
42,473
42,473
Short-term borrowings 1,860
4,118
5,330
11,308
(19,100)
2,158
(52,166)
(69,108)
Long-term debt:
Proceeds from issuance 1,789
-
1,700
3,489
8,297
1,347
(1,248)
8,396
Repayment (23,281)
(9,478)
(30,558)
(63,317)
(22,931)
(8,508)
(34,821)
(66,260)
Preferred stock:
Cash dividends paid (737)
-
-
(737)
(2,178)
-
-
(2,178)
Redeemed -
-
-
-
(25,000)
-
-
(25,000)
Common stock warrants repurchased (545)
-
-
(545)
-
-
-
-
Common stock:
Proceeds from issuance 1,375
-
-
1,375
21,976
-
-
21,976
Repurchased (91)
-
-
(91)
(220)
-
-
(220)
Cash dividends paid (1,045)
-
-
(1,045)
(2,125)
-
-
(2,125)
Excess tax benefits related to
stock option payments 98
-
-
98
18
-
-
18
Change in noncontrolling interests:
Purchase of Prudential's
noncontrolling interest -
-
-
-
-
-
(4,500)
(4,500)
Other, net -
1
(593)
(592)
-
(4)
(549)
(553)
Other, net -
-
-
-
(140)
-
140
-
Net cash used by
financing activities (20,577)
(5,359)
(197)
(26,133)
(41,403)
(5,007)
(50,671)
(97,081)
Net change in cash and
due from banks 2,935
(88)
(13,883)
(11,036)
11,656
28
(8,367)
3,317
Cash and due from banks
at beginning of year 27,314
454
(688)
27,080
15,658
426
7,679
23,763
Cash and due from banks
at end of year $ 30,249
366
(14,571)
16,044
27,314
454
(688)
27,080
218