WeightWatchers 2015 Annual Report Download - page 86
Download and view the complete annual report
Please find page 86 of the 2015 WeightWatchers annual report below. You can navigate through the pages in the report by either clicking on the pages listed below, or by using the keyword search tool below to find specific information within the annual report.-
 1
1 -
2
-
3
-
4
-
5
-
6
-
7
-
8
-
9
-
10
-
11
-
12
-
13
-
14
-
15
-
16
-
17
-
18
-
19
-
20
-
21
-
22
-
23
-
24
-
25
-
26
-
27
-
28
-
29
-
30
-
31
-
32
-
33
-
34
-
35
-
36
-
37
-
38
-
39
-
40
-
41
-
42
-
43
-
44
-
45
-
46
-
47
-
48
-
49
-
50
-
51
-
52
-
53
-
54
-
55
-
56
-
57
-
58
-
59
-
60
-
61
-
62
-
63
-
64
-
65
-
66
-
67
-
68
-
69
-
70
-
71
-
72
-
73
-
74
-
75
-
 76
76 -
 77
77 -
 78
78 -
 79
79 -
 80
80 -
 81
81 -
 82
82 -
 83
83 -
 84
84 -
 85
85 -
 86
86 -
 87
87 -
 88
88 -
 89
89 -
 90
90 -
 91
91 -
 92
92 -
 93
93 -
 94
94 -
 95
95 -
 96
96 -
97
-
98
-
99
-
100
-
101
-
102
-
103
-
104
-
105
-
106
-
107
-
108
-
109
-
110
-
111
-
112
-
113
-
114
-
115
-
116
-
117
-
118
-
119
-
120
-
121
-
122
-
123
-
124
-
125
-
126
-
127
-
128
-
129
-
130
-
131
-
132
-
133
-
134
-
135
-
136
-
137
-
138
-
139
-
140
-
141
-
142
-
143
-
144
-
145
-
146
-
147
-
148
-
149
-
150
-
151
-
152
-
153
-
154
-
155
-
156
-
157
-
158
-
159
 |
 |
WEIGHT WATCHERS INTERNATIONAL, INC. AND SUBSIDIARIES
NOTES TO CONSOLIDATED FINANCIAL STATEMENTS
(IN THOUSANDS, EXCEPT PER SHARE AMOUNTS)
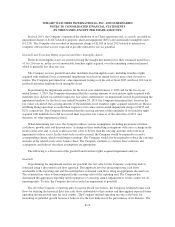
Company then discounted the estimated future cash flows utilizing a discount rate which was calculated using the
average cost of capital, which included the cost of equity and the cost of debt. The cost of equity was determined
by combining a risk-free rate of return and a market risk premium for the Company’s peer group. The risk-free
rate of return was generally determined based on the average rate of long-term U.S. Treasury securities. The
market risk premium was generally determined by reviewing external market data. The cost of debt was
determined by estimating the Company’s current borrowing rate.
As it relates to the impairment analysis for Brazil, the Company estimated future debt-free cash flows in
contemplation of its growth strategies for that market. In developing these projections, the Company considered
the historical impact of similar growth strategies in other markets as well as the current market conditions in
Brazil. The Company then discounted the estimated future cash flows utilizing a discount rate which was
calculated using the average cost of capital, which included the cost of equity and the cost of debt. The cost of
equity was determined by combining a risk-free rate of return and a market risk premium for the Company’s peer
group. The risk-free rate of return was generally determined based on the average rate of long-term U.S. Treasury
securities. The market risk premium was generally determined by reviewing external market data. Additional
consideration was given to the current economic conditions in Brazil and country specific risk as well as the rate
of growth projected in the analysis. The cost of debt was determined by estimating the Company’s current
borrowing rate.
Franchise Rights Acquired
In performing the impairment analysis for indefinite-lived franchise rights acquired, the fair value for
franchise rights acquired is estimated using a discounted cash flow approach referred to as the hypothetical start-
up approach for franchise rights related to the Company’s meetings business and a relief from royalty
methodology for franchise rights related to the Company’s Online business. The aggregate estimated fair value
for these rights is then compared to the carrying value of the unit of accounting for those franchise rights. The
Company has determined the appropriate unit of account for purposes of assessing annual impairment to be the
combination of the rights in the meetings and Online businesses in the country in which the acquisitions have
occurred. The values of these franchise rights in the United States, Canada, United Kingdom, Australia, New
Zealand and other countries at January 2, 2016 were $675,515, $48,435, $11,858, $6,563, $4,833, and $122,
respectively, totaling $747,326 and the values at January 3, 2015 were $675,515, $57,579, $13,138, $7,272,
$5,449 and $1,930, respectively, totaling $760,883.
The Company estimated future cash flows for each unit of accounting by utilizing a hypothetical start-up
approach in which it assumed that the year of maturity was reached after 7 years. Subsequent to the year of
maturity, the Company assumed debt-free cash flow growth rates based on its expected future operating income
growth rates for such country. The Company utilized operating income as the basis for measuring its potential
growth because it believes it is the best indicator of the performance of its business. The Company then
discounted the estimated future cash flows utilizing discount rates consistent with those used in its goodwill
impairment analysis as discussed above.
Other Intangible Assets
The Company expenses all software costs (including website development costs) incurred during the
preliminary project stage and capitalizes all internal and external direct costs of materials and services consumed
in developing software (including website development costs) once the development has reached the application
development stage. Application development stage costs generally include software configuration, coding,
installation to hardware and testing. These costs are amortized over their estimated useful life of 3 years for
website development costs and from 3 to 5 years for all other software costs. All costs incurred for upgrades,
F-11