WeightWatchers 2015 Annual Report Download - page 50
Download and view the complete annual report
Please find page 50 of the 2015 WeightWatchers annual report below. You can navigate through the pages in the report by either clicking on the pages listed below, or by using the keyword search tool below to find specific information within the annual report.-
 1
1 -
2
-
3
-
4
-
5
-
6
-
7
-
8
-
9
-
10
-
11
-
12
-
13
-
14
-
15
-
16
-
17
-
18
-
19
-
20
-
21
-
22
-
23
-
24
-
25
-
26
-
27
-
28
-
29
-
30
-
31
-
32
-
33
-
34
-
35
-
36
-
37
-
38
-
39
-
 40
40 -
 41
41 -
 42
42 -
 43
43 -
 44
44 -
 45
45 -
 46
46 -
 47
47 -
 48
48 -
 49
49 -
 50
50 -
 51
51 -
 52
52 -
 53
53 -
 54
54 -
 55
55 -
 56
56 -
 57
57 -
 58
58 -
 59
59 -
 60
60 -
61
-
62
-
63
-
64
-
65
-
66
-
67
-
68
-
69
-
70
-
71
-
72
-
73
-
74
-
75
-
76
-
77
-
78
-
79
-
80
-
81
-
82
-
83
-
84
-
85
-
86
-
87
-
88
-
89
-
90
-
91
-
92
-
93
-
94
-
95
-
96
-
97
-
98
-
99
-
100
-
101
-
102
-
103
-
104
-
105
-
106
-
107
-
108
-
109
-
110
-
111
-
112
-
113
-
114
-
115
-
116
-
117
-
118
-
119
-
120
-
121
-
122
-
123
-
124
-
125
-
126
-
127
-
128
-
129
-
130
-
131
-
132
-
133
-
134
-
135
-
136
-
137
-
138
-
139
-
140
-
141
-
142
-
143
-
144
-
145
-
146
-
147
-
148
-
149
-
150
-
151
-
152
-
153
-
154
-
155
-
156
-
157
-
158
-
159
 |
 |

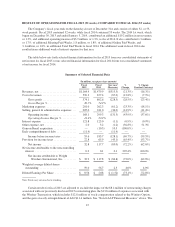
RESULTS OF OPERATIONS FOR FISCAL 2015 (52 weeks) COMPARED TO FISCAL 2014 (53 weeks)
The Company’s fiscal year ends on the Saturday closest to December 31st and consists of either 52- or 53-
week periods. Fiscal 2015 contained 52 weeks, while fiscal 2014 contained 53 weeks. The 2014 1st week, which
began on December 30, 2013 and ended January 5, 2014, contributed an additional $19.2 million in net revenues,
or 1.3%, and additional operating income of $3.9 million, or 1.3%, to fiscal 2014. It also contributed 1.3 million,
or 1.7%, of additional Meeting Paid Weeks, 1.8 million, or 1.8%, of additional Online Paid Weeks, and
3.1 million, or 1.8%, in additional Total Paid Weeks to fiscal 2014. The additional week in fiscal 2014 also
resulted in an additional week of interest expense for that year.
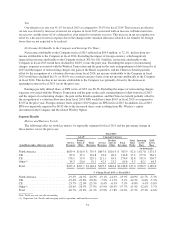
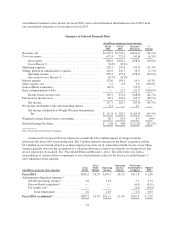
The table below sets forth selected financial information for fiscal 2015 from our consolidated statements of
net income for fiscal 2015 versus selected financial information for fiscal 2014 from our consolidated statements
of net income for fiscal 2014.
Summary of Selected Financial Data
(In millions, except per share amounts)
Fiscal
2015
Fiscal
2014
Increase/
(Decrease)
%
Change
% Change
Constant Currency
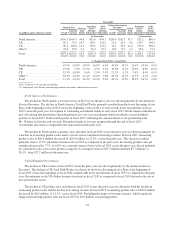
Revenues, net .......................... $1,164.4 $1,479.9 $(315.5) (21.3%) (16.3%)
Cost of revenues ........................ 590.3 677.4 (87.0) (12.8%) (7.9%)
Gross profit ........................ 574.1 802.6 (228.5) (28.5%) (23.4%)
Gross Margin % .................... 49.3% 54.2%
Marketing expenses ..................... 201.0 262.3 (61.2) (23.3%) (18.1%)
Selling, general & administrative expenses . . . 205.0 241.0 (36.0) (14.9%) (11.4%)
Operating income ................... 168.1 299.3 (131.3) (43.9%) (37.6%)
Operating Income Margin % .......... 14.4% 20.2%
Interest expense ........................ 121.8 123.0 (1.1) (0.9%) (0.9%)
Other expense, net ...................... 2.0 3.2 (1.2) (36.8%) 51.3%
Gain on Brazil acquisition ................ — (10.5) 10.5 (100.0%) —
Early extinguishment of debt .............. (11.4) — (11.4) — —
Income before income taxes ........... 55.6 183.7 (128.1) (69.7%) (59.5%)
Provision for income taxes ................ 22.8 65.9 (43.1) (65.4%) (53.7%)
Net income ........................ 32.8 117.7 (85.0) (72.2%) (62.6%)
Net income attributable to the noncontrolling
interest ............................. 0.2 0.1 0.1 207.4% 100.0%
Net income attributable to Weight
Watchers International, Inc. ......... $ 32.9 $ 117.8 $ (84.8) (72.0%) (62.8%)
Weighted average diluted shares
outstanding .......................... 59.0 56.7 2.3 4.0% 4.0%
Diluted Earnings Per Share ............... $ 0.56 $ 2.08 $ (1.52) (73.1%) (72.8%)
Note: Totals may not sum due to rounding.
Certain results for fiscal 2015 are adjusted to exclude the impact of the $8.4 million of restructuring charges
associated with our previously disclosed 2015 restructuring plan, the $13.6 million of expenses associated with
the Winfrey Transaction, which includes $12.8 million of stock compensation related to the Winfrey Option,
and the gain on early extinguishment of debt $11.4 million. See “Non-GAAP Financial Measures” above. The
47