WeightWatchers 2015 Annual Report Download - page 48
Download and view the complete annual report
Please find page 48 of the 2015 WeightWatchers annual report below. You can navigate through the pages in the report by either clicking on the pages listed below, or by using the keyword search tool below to find specific information within the annual report.-
 1
1 -
2
-
3
-
4
-
5
-
6
-
7
-
8
-
9
-
10
-
11
-
12
-
13
-
14
-
15
-
16
-
17
-
18
-
19
-
20
-
21
-
22
-
23
-
24
-
25
-
26
-
27
-
28
-
29
-
30
-
31
-
32
-
33
-
34
-
35
-
36
-
37
-
 38
38 -
 39
39 -
 40
40 -
 41
41 -
 42
42 -
 43
43 -
 44
44 -
 45
45 -
 46
46 -
 47
47 -
 48
48 -
 49
49 -
 50
50 -
 51
51 -
 52
52 -
 53
53 -
 54
54 -
 55
55 -
 56
56 -
 57
57 -
 58
58 -
59
-
60
-
61
-
62
-
63
-
64
-
65
-
66
-
67
-
68
-
69
-
70
-
71
-
72
-
73
-
74
-
75
-
76
-
77
-
78
-
79
-
80
-
81
-
82
-
83
-
84
-
85
-
86
-
87
-
88
-
89
-
90
-
91
-
92
-
93
-
94
-
95
-
96
-
97
-
98
-
99
-
100
-
101
-
102
-
103
-
104
-
105
-
106
-
107
-
108
-
109
-
110
-
111
-
112
-
113
-
114
-
115
-
116
-
117
-
118
-
119
-
120
-
121
-
122
-
123
-
124
-
125
-
126
-
127
-
128
-
129
-
130
-
131
-
132
-
133
-
134
-
135
-
136
-
137
-
138
-
139
-
140
-
141
-
142
-
143
-
144
-
145
-
146
-
147
-
148
-
149
-
150
-
151
-
152
-
153
-
154
-
155
-
156
-
157
-
158
-
159
 |
 |

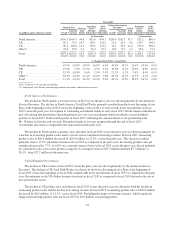
For all of the Company’s reporting units except for Brazil (see below), we estimated future cash flows by
utilizing the historical debt-free cash flows attributable to that country and then applied expected future operating
income growth rates for such country. We utilized operating income as the basis for measuring our potential
growth because we believe it is the best indicator of the performance of our business. We then discounted the
estimated future cash flows utilizing a discount rate which was calculated using the average cost of capital, which
includes the cost of equity and the cost of debt. The cost of equity was determined by combining a risk-free rate
of return and a market risk premium for the Company’s peer group. The risk-free rate of return was generally
determined based on the average rate of long-term U.S. Treasury securities. The market risk premium was
generally determined by reviewing external market data. The cost of debt was determined by estimating the
Company’s current borrowing rate.
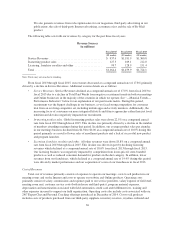
The following are the more significant assumptions utilized in our impairment analysis for fiscal 2015 and
2014:
January 2,
2016
January 3,
2015
Debt-Free Cash Flow Growth Rate ............................... 0%to6% -5%to14%
Discount Rate ................................................ 9.3% 10.3%
As it relates to our impairment analysis for Brazil, we estimated future debt free cash flows in contemplation
of our growth strategies for that market. In developing these projections, we considered the historical impact of
similar growth strategies in other markets as well as the current market conditions in Brazil. We then discounted
the estimated future cash flows utilizing a discount rate which was calculated using the average cost of capital,
which included the cost of equity and the cost of debt. The cost of equity was determined by combining a risk-
free rate of return and a market risk premium for the Company’s peer group. The risk-free rate of return was
generally determined based on the average rate of long-term U.S. Treasury securities. The market risk premium
was generally determined by reviewing external market data. Additional consideration was given to the current
economic conditions in Brazil and the country specific risk thereon, as well as the risk associated with the rate of
growth projected in the analysis. The cost of debt was determined by estimating the Company’s current
borrowing rate. Accordingly, in our fiscal 2015 impairment analysis, we assumed a cumulative annual growth
rate for our debt-free cash flows of 51% and a discount rate of 17.8%.
Franchise Rights Acquired
In performing the impairment analysis for our indefinite-lived franchise rights acquired, the fair value for
our franchise rights acquired is estimated using a discounted cash flow approach referred to as the hypothetical
start-up approach for our franchise rights related to our meetings business and a relief from royalty methodology
for our franchise rights related to our Online business. The aggregate estimated fair value for these rights is then
compared to the carrying value of the unit of accounting for those franchise rights. We have determined the
appropriate unit of account for purposes of assessing annual impairment to be the combination of the rights in the
meetings and Online businesses in the country in which the acquisitions have occurred. The values of these
franchise rights in the United States, Canada, United Kingdom, Australia, New Zealand and other countries at
January 2, 2016 were $675.6 million, $48.4 million, $11.8 million, $6.6 million, $4.8 million, and $0.1 million,
respectively.
Based on the results of our fiscal 2015 impairment analysis, we estimated that approximately 99% of our
franchise rights acquired had a fair value at least 50% higher than their carrying amount.
In our hypothetical start-up approach analysis for fiscal 2015 we assumed that the year of maturity was
reached after 7 years. Subsequent to the year of maturity, we assumed debt-free cash flow growth rates based on
our expected future operating income growth rates for such country. We utilized operating income as the basis
45