WeightWatchers 2015 Annual Report Download - page 32
Download and view the complete annual report
Please find page 32 of the 2015 WeightWatchers annual report below. You can navigate through the pages in the report by either clicking on the pages listed below, or by using the keyword search tool below to find specific information within the annual report.-
 1
1 -
2
-
3
-
4
-
5
-
6
-
7
-
8
-
9
-
10
-
11
-
12
-
13
-
14
-
15
-
16
-
17
-
18
-
19
-
20
-
21
-
 22
22 -
 23
23 -
 24
24 -
 25
25 -
 26
26 -
 27
27 -
 28
28 -
 29
29 -
 30
30 -
 31
31 -
 32
32 -
 33
33 -
 34
34 -
 35
35 -
 36
36 -
 37
37 -
 38
38 -
 39
39 -
 40
40 -
 41
41 -
 42
42 -
43
-
44
-
45
-
46
-
47
-
48
-
49
-
50
-
51
-
52
-
53
-
54
-
55
-
56
-
57
-
58
-
59
-
60
-
61
-
62
-
63
-
64
-
65
-
66
-
67
-
68
-
69
-
70
-
71
-
72
-
73
-
74
-
75
-
76
-
77
-
78
-
79
-
80
-
81
-
82
-
83
-
84
-
85
-
86
-
87
-
88
-
89
-
90
-
91
-
92
-
93
-
94
-
95
-
96
-
97
-
98
-
99
-
100
-
101
-
102
-
103
-
104
-
105
-
106
-
107
-
108
-
109
-
110
-
111
-
112
-
113
-
114
-
115
-
116
-
117
-
118
-
119
-
120
-
121
-
122
-
123
-
124
-
125
-
126
-
127
-
128
-
129
-
130
-
131
-
132
-
133
-
134
-
135
-
136
-
137
-
138
-
139
-
140
-
141
-
142
-
143
-
144
-
145
-
146
-
147
-
148
-
149
-
150
-
151
-
152
-
153
-
154
-
155
-
156
-
157
-
158
-
159
 |
 |
stock. See “Item 7. Management’s Discussion and Analysis of Financial Condition and Results of Operations—
Liquidity and Capital Resources—Long-Term Debt” in Part II, and “Item 15. Exhibits and Financial Statement
Schedules—Financial Statements—Note 7. Long-Term Debt”, of this Annual Report on Form 10-K for a
description of the WWI Credit Facility.
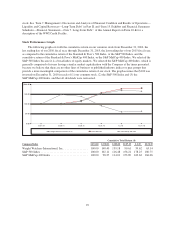
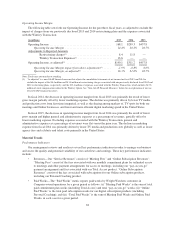
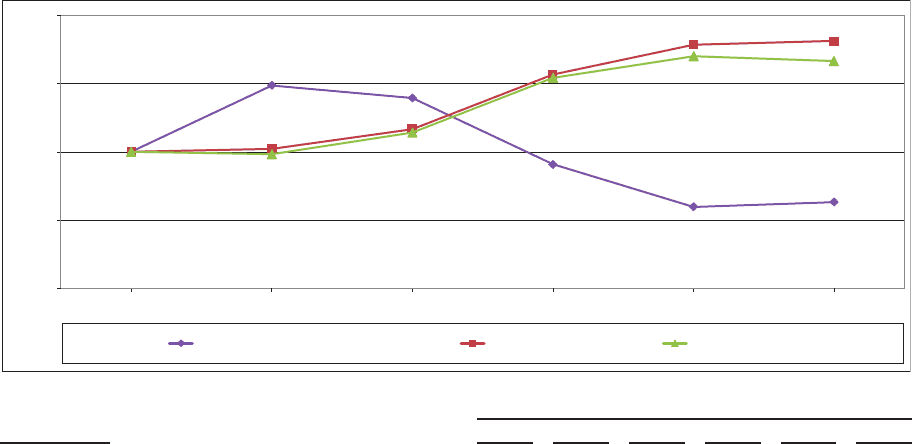
Stock Performance Graph
The following graph sets forth the cumulative return on our common stock from December 31, 2010, the
last trading day of our 2010 fiscal year, through December 31, 2015, the last trading day of our 2015 fiscal year,
as compared to the cumulative return of the Standard & Poor’s 500 Index, or the S&P 500 Index, and the
cumulative return of the Standard & Poor’s MidCap 400 Index, or the S&P MidCap 400 Index. We selected the
S&P 500 Index because it is a broad index of equity markets. We selected the S&P MidCap 400 Index, which is
generally comprised of issuers having a similar market capitalization with the Company at the times presented,
because we believe that there are no other lines of business or published industry indices or peer groups that
provide a more meaningful comparison of the cumulative return of our stock. The graph assumes that $100 was
invested on December 31, 2010 in each of (1) our common stock, (2) the S&P 500 Index and (3) the
S&P MidCap 400 Index, and that all dividends were reinvested.
12.31.10 12.30.11 12.28.12 12.27.13 1.2.15 12.31.15
0.00
50.00
100.00
150.00
$200.00
S&P 500 IndexWeight Watchers International, Inc. S&P MidCap 400 Index
Cumulative Total Return ($)
Company/Index 12.31.10 12.30.11 12.28.12 12.27.13 1.2.15 12.31.15
Weight Watchers International, Inc. ................ 100.00 148.40 139.18 90.61 59.62 63.14
S&P 500 Index ................................. 100.00 102.11 116.48 156.21 178.25 180.75
S&P MidCap 400 Index .......................... 100.00 98.27 114.01 153.89 169.62 166.06
29