WeightWatchers 2015 Annual Report Download - page 60
Download and view the complete annual report
Please find page 60 of the 2015 WeightWatchers annual report below. You can navigate through the pages in the report by either clicking on the pages listed below, or by using the keyword search tool below to find specific information within the annual report.-
 1
1 -
2
-
3
-
4
-
5
-
6
-
7
-
8
-
9
-
10
-
11
-
12
-
13
-
14
-
15
-
16
-
17
-
18
-
19
-
20
-
21
-
22
-
23
-
24
-
25
-
26
-
27
-
28
-
29
-
30
-
31
-
32
-
33
-
34
-
35
-
36
-
37
-
38
-
39
-
40
-
41
-
42
-
43
-
44
-
45
-
46
-
47
-
48
-
49
-
 50
50 -
 51
51 -
 52
52 -
 53
53 -
 54
54 -
 55
55 -
 56
56 -
 57
57 -
 58
58 -
 59
59 -
 60
60 -
 61
61 -
 62
62 -
 63
63 -
 64
64 -
 65
65 -
 66
66 -
 67
67 -
 68
68 -
 69
69 -
 70
70 -
71
-
72
-
73
-
74
-
75
-
76
-
77
-
78
-
79
-
80
-
81
-
82
-
83
-
84
-
85
-
86
-
87
-
88
-
89
-
90
-
91
-
92
-
93
-
94
-
95
-
96
-
97
-
98
-
99
-
100
-
101
-
102
-
103
-
104
-
105
-
106
-
107
-
108
-
109
-
110
-
111
-
112
-
113
-
114
-
115
-
116
-
117
-
118
-
119
-
120
-
121
-
122
-
123
-
124
-
125
-
126
-
127
-
128
-
129
-
130
-
131
-
132
-
133
-
134
-
135
-
136
-
137
-
138
-
139
-
140
-
141
-
142
-
143
-
144
-
145
-
146
-
147
-
148
-
149
-
150
-
151
-
152
-
153
-
154
-
155
-
156
-
157
-
158
-
159
 |
 |

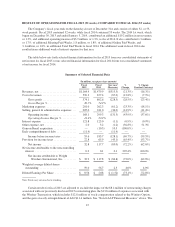
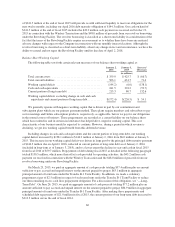
Other Expense, Net
Other expense, net, which consists of the impact of foreign currency on intercompany transactions, increased by
$2.6 million in fiscal 2014 versus the prior year.
Tax
Our effective tax rate was 35.9% for fiscal 2014 as compared to 39.0% for fiscal 2013. The decrease was due
mainly to the net tax benefit associated with the closure of our China business that was recorded in fiscal 2014 and a
shift in the mix of our domestic and foreign earnings which resulted in lower state income taxes. These were offset by
the recognition of a valuation allowance that was recorded in fiscal 2014 related to tax benefits previously recorded for
foreign losses that are not expected to be realized.
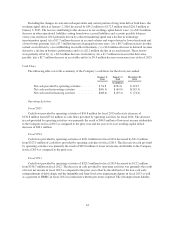
Net Income Attributable to the Company and Earnings Per Share
Net income attributable to the Company in fiscal 2014 declined 41.9% versus fiscal 2013. Excluding the impact of
the 2014 restructuring charges, the gain on the Brazil acquisition, the net tax benefit offset by the recognition of a
valuation allowance, and the early extinguishment of debt charge, net income attributable to the Company in fiscal
2014 would have declined 46.2% versus the adjusted prior year. This decline in net income attributable to the
Company was primarily driven by the decrease in operating income in fiscal 2014 versus the prior year.
EPS in fiscal 2014 decreased to $2.08 versus fiscal 2013. Excluding the impact of the 2014 restructuring charges,
the gain on the Brazil acquisition, the net tax benefit offset by the recognition of a valuation allowance and the early
extinguishment of debt charge, EPS would have been $2.05 in fiscal 2014 as compared to $3.86 in the prior year.
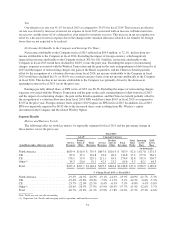
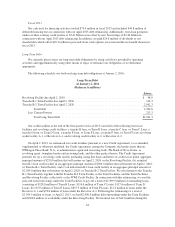
Segment Results
Metrics and Business Trends
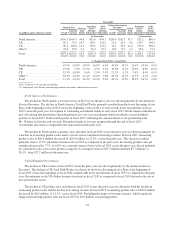
The following tables set forth key metrics by reportable segment for fiscal 2014 and the percentage change in
those metrics versus the prior year:
Fiscal 2014
GAAP Constant Currency
(in millions unless otherwise stated)
Service
Revenues
Product
Sales &
Other
Total
Revenues
Service
Revenues
Product
Sales &
Other
Total
Revenues
Total
Paid
Weeks
Incoming
Active
Base
EOP
Active
Base
(in thousands)
North America .................. $ 794.4 $153.3 $ 947.7 $ 799.6 $153.8 $ 953.4 117.1 2,066.1 1,617.8
UK............................ 108.6 48.2 156.8 102.7 45.6 148.3 20.2 297.4 277.8
CE ............................ 230.9 68.0 298.9 230.5 67.6 298.1 35.6 528.4 551.9
Other(1) ........................ 48.0 28.4 76.5 50.6 29.4 79.9 4.9 71.1 62.1
Total .......................... $1,181.9 $298.0 $1,479.9 $1,183.4 $296.2 $1,479.6 177.8 2,962.9 2,509.5
% Change Fiscal 2014 vs. Fiscal 2013
North America ................... -18.0% -21.9% -18.6% -17.4% -21.6% -18.1% -16.8% -12.3% -21.7%
UK ............................ -5.5% -16.6% -9.2% -10.6% -21.2% -14.1% -9.2% -14.3% -6.6%
CE ............................ 1.2% -4.6% -0.2% 1.0% -5.2% -0.4% 3.1% 14.6% 4.4%
Other(1) ......................... -2.8% -25.1% -12.5% 2.4% -22.8% -8.5% -2.2% -7.1% -12.6%
Total ........................... -13.1% -18.0% -14.2% -13.0% -18.5% -14.2% -12.2% -8.6% -15.3%
Note: Totals may not sum due to rounding
(1) Represents Asia Pacific and emerging markets operations and franchise revenues.
57