WeightWatchers 2015 Annual Report Download - page 56
Download and view the complete annual report
Please find page 56 of the 2015 WeightWatchers annual report below. You can navigate through the pages in the report by either clicking on the pages listed below, or by using the keyword search tool below to find specific information within the annual report.-
 1
1 -
2
-
3
-
4
-
5
-
6
-
7
-
8
-
9
-
10
-
11
-
12
-
13
-
14
-
15
-
16
-
17
-
18
-
19
-
20
-
21
-
22
-
23
-
24
-
25
-
26
-
27
-
28
-
29
-
30
-
31
-
32
-
33
-
34
-
35
-
36
-
37
-
38
-
39
-
40
-
41
-
42
-
43
-
44
-
45
-
 46
46 -
 47
47 -
 48
48 -
 49
49 -
 50
50 -
 51
51 -
 52
52 -
 53
53 -
 54
54 -
 55
55 -
 56
56 -
 57
57 -
 58
58 -
 59
59 -
 60
60 -
 61
61 -
 62
62 -
 63
63 -
 64
64 -
 65
65 -
 66
66 -
67
-
68
-
69
-
70
-
71
-
72
-
73
-
74
-
75
-
76
-
77
-
78
-
79
-
80
-
81
-
82
-
83
-
84
-
85
-
86
-
87
-
88
-
89
-
90
-
91
-
92
-
93
-
94
-
95
-
96
-
97
-
98
-
99
-
100
-
101
-
102
-
103
-
104
-
105
-
106
-
107
-
108
-
109
-
110
-
111
-
112
-
113
-
114
-
115
-
116
-
117
-
118
-
119
-
120
-
121
-
122
-
123
-
124
-
125
-
126
-
127
-
128
-
129
-
130
-
131
-
132
-
133
-
134
-
135
-
136
-
137
-
138
-
139
-
140
-
141
-
142
-
143
-
144
-
145
-
146
-
147
-
148
-
149
-
150
-
151
-
152
-
153
-
154
-
155
-
156
-
157
-
158
-
159
 |
 |
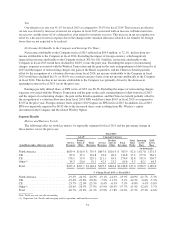
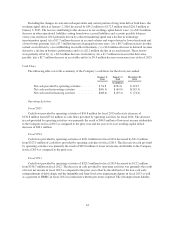
sales in fiscal 2015 would have declined 14.6% versus the prior year. This decrease resulted primarily from a
14.4% attendance decline in fiscal 2015 as compared to fiscal 2014. In-meeting product sales per attendee
decreased by 7.8%, but decreased a minimal 0.1% on a constant currency basis, in fiscal 2015 versus the prior
year. Licensing revenue of $12.0 million declined $3.9 million, or 24.3%, or 18.5% on a constant currency basis,
from $15.8 million in the prior year.
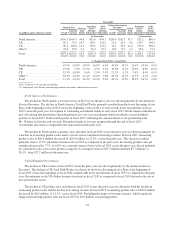
Continental Europe Performance
The decline in Continental Europe revenues in fiscal 2015 versus the prior year was driven primarily by the
decline in Service Revenues. The decrease in Continental Europe Service Revenues in fiscal 2015 versus the
prior year was primarily the result of a decrease in Meeting Fees and to a lesser extent by a decrease in Online
Subscriptions Revenues. This decrease in Meeting Fees was driven by the lower Incoming Active Base at the
beginning of fiscal 2015 versus the beginning of fiscal 2014 coupled with lower recruitments in fiscal 2015 as
compared to the prior year. Although lower recruitments in the CE Online business in fiscal 2015 versus the prior
year negatively impacted Online Paid Weeks, the higher number of Incoming Active Online Subscribers at the
start of fiscal 2015 versus the start of fiscal 2014 benefitted Online Subscription Revenues in fiscal 2015.
Continental Europe product sales and other in fiscal 2015 was driven primarily by a decline in in-meeting
product sales. In-meeting product sales of $34.2 million decreased by $12.1 million, or 26.1%, versus fiscal
2014. Excluding the impact of foreign currency, which negatively impacted in-meeting product sales for fiscal
2015 by $6.9 million, in-meeting product sales in fiscal 2015 would have declined 11.2% versus the prior year.
This decrease resulted primarily from a 13.3% attendance decline in fiscal 2015 as compared to fiscal 2014. In-
meeting product sales per attendee decreased by 14.8%, but increased by 2.4% on a constant currency basis, in
fiscal 2015 versus the prior year primarily due to lower attendances partially offset by new product launches.
Other Performance
The decline in Other revenue in fiscal 2015 versus fiscal 2014 was primarily driven by revenue declines in
Asia Pacific. The decrease in Other Service Revenues in fiscal 2015 versus the prior year was primarily driven by
a decline in Other Meeting Paid Weeks, and to a lesser extent by a decline in Other Online Paid Weeks, in Asia
Pacific. The declines in paid weeks in Asia Pacific were driven by the lower Incoming Active Base for each of
the meetings and Online businesses at the beginning of fiscal 2015 versus the beginning of fiscal 2014 and lower
recruitments in fiscal 2015 as compared to fiscal 2014.
The decline in Other product sales and other in fiscal 2015 versus fiscal 2014 was driven in part by a decline
in Asia Pacific in-meeting product sales and licensing revenue and from a decline in revenue from our
franchisees. Revenues from our franchisees totaled $9.9 million in fiscal 2015, a decline of $1.5 million, or 15%,
from the prior year, driven in part by the decline in their meetings business performance, similar to that which we
experienced in North America. In fiscal 2015, in-meeting product sales of $4.4 million decreased by $3.0
million, or 40.1%, or 28.2% on a constant currency basis, versus the prior year driven by volume declines as well
as a decline in product sales per attendee in Asia Pacific of 22.6%, or 7.1% in constant currency.
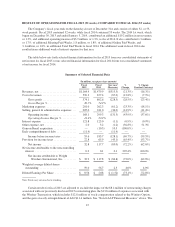
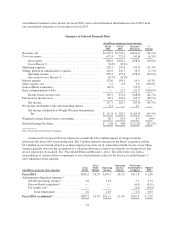
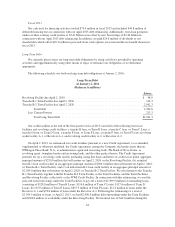
RESULTS OF OPERATIONS FOR FISCAL 2014 (53 weeks) COMPARED TO FISCAL 2013 (52 weeks)
The Company’s fiscal year ends on the Saturday closest to December 31st and consists of either 52- or
53-week periods. Fiscal 2014 contained 53 weeks, while fiscal 2013 contained 52 weeks. The 2014 53rd week,
which began on December 28, 2014 and ended on January 3, 2015, contributed 1.8 million, or 0.9%, to Total
Paid Weeks for fiscal 2014. It also added 0.2 million, or 0.6%, in additional global attendances to fiscal 2014,
and drove additional revenues of $14.0 million, or 0.9%, to fiscal 2014. Due to the timing of the 53rd week,
additional marketing expense drove a decline in fiscal 2014 operating income. The 53rd week also resulted in an
additional week of interest expense. As a result, in the aggregate the 53rd week had a negative $0.05 per share
impact on fiscal 2014 EPS. The table below sets forth selected financial information for fiscal 2014 from our
53