WeightWatchers 2015 Annual Report Download - page 61
Download and view the complete annual report
Please find page 61 of the 2015 WeightWatchers annual report below. You can navigate through the pages in the report by either clicking on the pages listed below, or by using the keyword search tool below to find specific information within the annual report.-
 1
1 -
2
-
3
-
4
-
5
-
6
-
7
-
8
-
9
-
10
-
11
-
12
-
13
-
14
-
15
-
16
-
17
-
18
-
19
-
20
-
21
-
22
-
23
-
24
-
25
-
26
-
27
-
28
-
29
-
30
-
31
-
32
-
33
-
34
-
35
-
36
-
37
-
38
-
39
-
40
-
41
-
42
-
43
-
44
-
45
-
46
-
47
-
48
-
49
-
50
-
 51
51 -
 52
52 -
 53
53 -
 54
54 -
 55
55 -
 56
56 -
 57
57 -
 58
58 -
 59
59 -
 60
60 -
 61
61 -
 62
62 -
 63
63 -
 64
64 -
 65
65 -
 66
66 -
 67
67 -
 68
68 -
 69
69 -
 70
70 -
 71
71 -
72
-
73
-
74
-
75
-
76
-
77
-
78
-
79
-
80
-
81
-
82
-
83
-
84
-
85
-
86
-
87
-
88
-
89
-
90
-
91
-
92
-
93
-
94
-
95
-
96
-
97
-
98
-
99
-
100
-
101
-
102
-
103
-
104
-
105
-
106
-
107
-
108
-
109
-
110
-
111
-
112
-
113
-
114
-
115
-
116
-
117
-
118
-
119
-
120
-
121
-
122
-
123
-
124
-
125
-
126
-
127
-
128
-
129
-
130
-
131
-
132
-
133
-
134
-
135
-
136
-
137
-
138
-
139
-
140
-
141
-
142
-
143
-
144
-
145
-
146
-
147
-
148
-
149
-
150
-
151
-
152
-
153
-
154
-
155
-
156
-
157
-
158
-
159
 |
 |

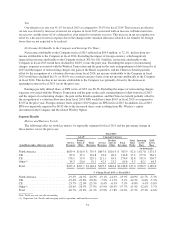
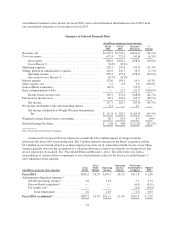
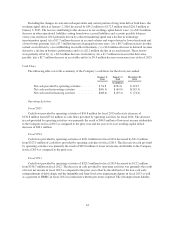
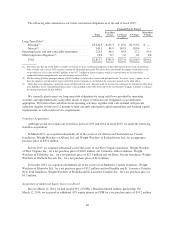
Fiscal 2014
Meeting Fees Meeting
Paid
Weeks
Incoming
Active
Meeting
Subscribers
EOP Active
Meeting
Subscribers
Online
Subscription
Revenues Online
Paid
Weeks
Incoming
Active
Online
Subscribers
EOP
Active
Online
Subscribers(in millions unless otherwise stated) GAAP
Constant
Currency GAAP
Constant
Currency
(in thousands) (in thousands)
North America .............$496.2 $499.3 50.3 833.2 692.6 $298.2 $300.3 66.8 1,232.9 925.2
UK ...................... 80.8 76.4 12.4 166.0 158.1 27.9 26.4 7.9 131.4 119.7
CE ...................... 133.4 133.0 12.8 183.6 178.2 97.4 97.5 22.8 344.8 373.6
Other(1) ................... 34.1 35.6 2.7 33.9 26.4 13.9 15.0 2.1 37.1 35.6
Total .....................$744.6 $744.3 78.2 1,216.7 1,055.4 $437.4 $439.1 99.6 1,746.2 1,454.1
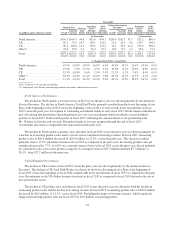
% Change Fiscal 2014 vs. Fiscal 2013
North America ............ -16.6% -16.1% -15.8% -11.7% -16.9% -20.1% -19.6% -17.5% -12.6% -25.0%
UK ..................... -5.2% -10.4% -9.6% -18.7% -4.7% -6.2% -11.3% -8.6% -8.0% -8.9%
CE ..................... -2.8% -3.1% -2.5% -0.9% -2.9% 7.3% 7.4% 6.5% 25.0% 8.4%
Other(1) .................. 0.3% 4.8% 6.2% -3.4% -22.0% -9.6% -2.9% -11.0% -10.2% -4.1%
Total .................... -12.6% -12.6% -12.3% -11.1% -13.3% -14.1% -13.8% -12.2% -6.7% -16.7%
Note: Totals may not sum due to rounding
(1) Represents Asia Pacific and emerging markets operations and franchise revenues.
North America Performance
North America continued to face strong competition for consumer trial from an evolving competitor set, including
mobile apps and activity monitors, during fiscal 2014. The Company believes this competition drove declines in all
revenue categories in North America in fiscal 2014 versus the prior year. The decline in North America Total Paid
Weeks primarily resulted from the lower Incoming Active Base at the beginning of fiscal 2014 versus the beginning of
fiscal 2013 as well as from lower recruitments in fiscal 2014 versus the prior year. In response to weakening
recruitment trends in early fiscal 2014, North America introduced new advertising and implemented new promotional
tactics. In addition, the United States launched its 2014 winter season brand campaign one month early.
The decline in North America product sales and other was driven primarily by a decline in in-meeting product
sales and to a lesser extent a decline in licensing revenue. In fiscal 2014, in-meeting product sales of $85.2 million
decreased by $33.9 million, or 28.5%, versus the prior year. This decrease resulted primarily from a 15.3% attendance
decline in fiscal 2014 as compared to the prior year. In-meeting product sales per attendee decreased by 15.5% in fiscal
2014 versus the prior year, driven primarily by a decline in sales of enrollment products. Licensing revenue of $37.2
million declined $1.4 million, or 3.7%, from $38.6 million in the prior year.
United Kingdom Performance
The decline in UK revenues in fiscal 2014 versus the prior year was driven primarily by the decline in product
sales and to a lesser extent a decline in Service Revenues. The decline in UK Total Paid Weeks was driven by the
lower Incoming Active Base at the beginning of fiscal 2014 versus the beginning of fiscal 2013 coupled with lower
recruitments in fiscal 2014 as compared to the prior year. In response to weakening recruitment trends, primarily in the
meetings business, early in fiscal 2014, the United Kingdom introduced new advertising, implemented new
promotional tactics and invested in a local marketing campaign to combat a strong local competitor. As a result of
these initiatives, although still negative in fiscal 2014, the United Kingdom experienced an improvement in its
recruitment trend in the second half of fiscal 2014 as compared to the prior year period.
The decline in UK product sales and other in fiscal 2014 versus the prior year was driven primarily by a decline in
in-meeting product sales and to a lesser extent a decline in licensing revenue. In fiscal 2014, in-meeting product sales
58