WeightWatchers 2015 Annual Report Download - page 62
Download and view the complete annual report
Please find page 62 of the 2015 WeightWatchers annual report below. You can navigate through the pages in the report by either clicking on the pages listed below, or by using the keyword search tool below to find specific information within the annual report.-
 1
1 -
2
-
3
-
4
-
5
-
6
-
7
-
8
-
9
-
10
-
11
-
12
-
13
-
14
-
15
-
16
-
17
-
18
-
19
-
20
-
21
-
22
-
23
-
24
-
25
-
26
-
27
-
28
-
29
-
30
-
31
-
32
-
33
-
34
-
35
-
36
-
37
-
38
-
39
-
40
-
41
-
42
-
43
-
44
-
45
-
46
-
47
-
48
-
49
-
50
-
51
-
 52
52 -
 53
53 -
 54
54 -
 55
55 -
 56
56 -
 57
57 -
 58
58 -
 59
59 -
 60
60 -
 61
61 -
 62
62 -
 63
63 -
 64
64 -
 65
65 -
 66
66 -
 67
67 -
 68
68 -
 69
69 -
 70
70 -
 71
71 -
 72
72 -
73
-
74
-
75
-
76
-
77
-
78
-
79
-
80
-
81
-
82
-
83
-
84
-
85
-
86
-
87
-
88
-
89
-
90
-
91
-
92
-
93
-
94
-
95
-
96
-
97
-
98
-
99
-
100
-
101
-
102
-
103
-
104
-
105
-
106
-
107
-
108
-
109
-
110
-
111
-
112
-
113
-
114
-
115
-
116
-
117
-
118
-
119
-
120
-
121
-
122
-
123
-
124
-
125
-
126
-
127
-
128
-
129
-
130
-
131
-
132
-
133
-
134
-
135
-
136
-
137
-
138
-
139
-
140
-
141
-
142
-
143
-
144
-
145
-
146
-
147
-
148
-
149
-
150
-
151
-
152
-
153
-
154
-
155
-
156
-
157
-
158
-
159
 |
 |
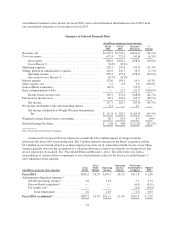
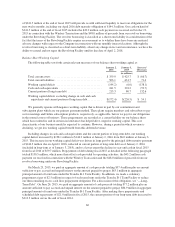
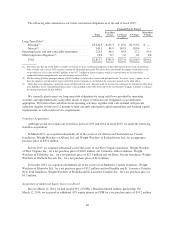
of $30.2 million decreased by $5.7 million, or 15.9%, versus the prior year. This decrease resulted primarily from
an 11.4% attendance decline in fiscal 2014 as compared to the prior year. In-meeting product sales per attendee
also declined by 5.0%, or 10.3% on a constant currency basis, in fiscal 2014 versus the prior year driven by the
impact of the Simple Start program on product sales. The decline in licensing revenue was driven by timing
associated with brand marketing.
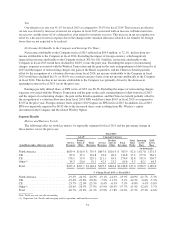
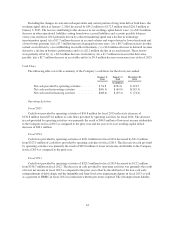
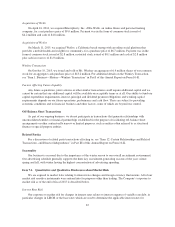
Continental Europe Performance
The decline in Continental Europe revenues in fiscal 2014 versus the prior year was driven primarily by the
decline in product sales and other partially offset by an increase in Service Revenues. The increase in Continental
Europe Service Revenues on a constant currency basis in fiscal 2014 versus fiscal 2013 was primarily the result
of an increase in Online Subscription Revenues versus the prior year. This increase in Online Subscription
Revenues was driven by the higher number of Incoming Active Online Subscribers at the start of fiscal 2014
versus the start of fiscal 2013 which drove higher Online Paid Weeks in the year as compared to the prior year.
This increase in Online Subscription Revenues more than offset a lower number of Incoming Active Meeting
Subscribers and recruitment softness in the meetings business, particularly in Germany, in fiscal 2014.
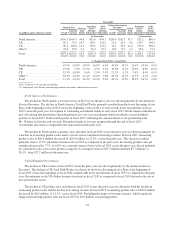
The decline in Continental Europe product sales and other in fiscal 2014 versus the prior year was driven
primarily by both a decline in in-meeting product sales and a decline in licensing revenue. In fiscal 2014, in-
meeting product sales of $46.3 million decreased by $1.7 million, or 3.6% (4.4% on a constant currency basis),
versus the prior year. This decrease resulted primarily from a 5.2% attendance decline in fiscal 2014 as compared
to the prior year. In fiscal 2014, licensing revenue of $10.1 million declined $2.0 million, or 16.2% (16.3% on a
constant currency basis), from $12.1 million in the prior year driven by the timing associated with brand
marketing.
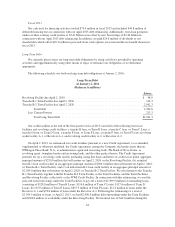
Other Performance
The decline in Other revenue in fiscal 2014 versus the prior year was driven by revenue declines in Asia
Pacific and with our franchisees, partially offset by the beneficial impact of the consolidation of the Brazil
operations. The increase in Other Service Revenues in fiscal 2014 versus the prior year was driven by a 6.2%
increase in Other Meeting Paid Weeks. The decline in fiscal 2014 Other Total Paid Weeks versus the prior year
was driven by the lower Incoming Active Base at the beginning of fiscal 2014 versus the beginning of fiscal 2013
and higher recruitments as compared to the prior year.
The decline in Other product sales and other in fiscal 2014 versus the prior year was driven primarily by a
decline in revenue from our franchisees and to a lesser extent our licensees. Revenues from our franchisees
totaled $11.4 million in fiscal 2014, a decline of $4.6 million, or 28.8%, from the prior year, driven in part by the
decline in their meetings business performance, similar to that which we experienced in North America, and in
the number of franchises resulting from our recent franchise acquisitions. In fiscal 2014, licensing revenue
declined in part due to the timing of brand revenue from our licensing partners. In fiscal 2014, in-meeting
product sales of $7.4 million decreased by $1.6 million, or 17.5% (14.5% on a constant currency basis), versus
the prior year driven by volume declines in Asia Pacific partially offset by the impact of the Brazil acquisition.
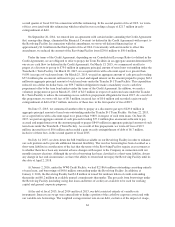
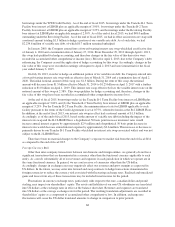
Liquidity and Capital Resources
Cash flows provided by operating activities have historically supplied, and are expected to continue to
supply, us with our primary source of liquidity. We use these cash flows, supplemented with long-term debt and
short-term borrowings, to fund our operations and global initiatives, pay down debt and opportunistically engage
in selective acquisitions. See “—Transformation Plan” for a discussion of our strategic initiatives. On
October 30, 2013, we announced that we suspended our quarterly cash dividend, as described below (see
“—Dividends”). We believe that cash generated by our revenue forecast for fiscal 2016 of approximately $1.2
billion, our continued cost focus, the launch of our 2016 winter season program innovation, and our cash on hand
59