WeightWatchers 2015 Annual Report Download - page 41
Download and view the complete annual report
Please find page 41 of the 2015 WeightWatchers annual report below. You can navigate through the pages in the report by either clicking on the pages listed below, or by using the keyword search tool below to find specific information within the annual report.-
 1
1 -
2
-
3
-
4
-
5
-
6
-
7
-
8
-
9
-
10
-
11
-
12
-
13
-
14
-
15
-
16
-
17
-
18
-
19
-
20
-
21
-
22
-
23
-
24
-
25
-
26
-
27
-
28
-
29
-
30
-
 31
31 -
 32
32 -
 33
33 -
 34
34 -
 35
35 -
 36
36 -
 37
37 -
 38
38 -
 39
39 -
 40
40 -
 41
41 -
 42
42 -
 43
43 -
 44
44 -
 45
45 -
 46
46 -
 47
47 -
 48
48 -
 49
49 -
 50
50 -
 51
51 -
52
-
53
-
54
-
55
-
56
-
57
-
58
-
59
-
60
-
61
-
62
-
63
-
64
-
65
-
66
-
67
-
68
-
69
-
70
-
71
-
72
-
73
-
74
-
75
-
76
-
77
-
78
-
79
-
80
-
81
-
82
-
83
-
84
-
85
-
86
-
87
-
88
-
89
-
90
-
91
-
92
-
93
-
94
-
95
-
96
-
97
-
98
-
99
-
100
-
101
-
102
-
103
-
104
-
105
-
106
-
107
-
108
-
109
-
110
-
111
-
112
-
113
-
114
-
115
-
116
-
117
-
118
-
119
-
120
-
121
-
122
-
123
-
124
-
125
-
126
-
127
-
128
-
129
-
130
-
131
-
132
-
133
-
134
-
135
-
136
-
137
-
138
-
139
-
140
-
141
-
142
-
143
-
144
-
145
-
146
-
147
-
148
-
149
-
150
-
151
-
152
-
153
-
154
-
155
-
156
-
157
-
158
-
159
 |
 |

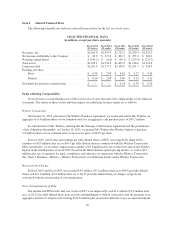
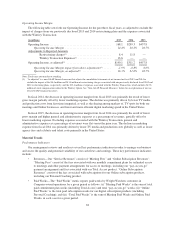
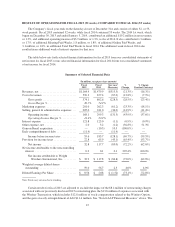
Operating Income Margin
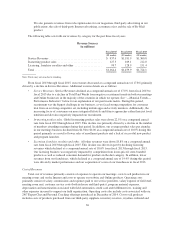
The following table sets forth our Operating Income for the past three fiscal years, as adjusted to exclude the
impact of charges from our previously disclosed 2015 and 2014 restructuring plans and the expenses associated
with the Winfrey Transaction:
(in millions) 2015 2014 2013
Operating Income ........................................... 168.1 $299.3 $457.8
Operating Income Margin ................................ 14.4% 20.2% 26.5%
Adjustments to Reported Amounts
Restructuring charges(1) .............................. 8.4 11.8 —
Winfrey Transaction Expenses(1) ....................... 13.6 — —
Operating Income, as adjusted(1) ............................... $190.1 $311.2 $457.8
Operating Income Margin impact from above adjustments(1) ..... -1.9% -0.8% 0.0%
Operating Income Margin, as adjusted(1) .................... 16.3% 21.0% 26.5%
Note: Totals may not sum due to rounding
(1) “As adjusted” is a non-GAAP financial measure that adjusts the consolidated statements of net income for fiscal 2015 and 2014 to
exclude the impact of the $8.4 million and $11.8 million of restructuring charges associated with our previously disclosed fiscal 2015 and
2014 restructuring plans, respectively, and the $13.6 million of expenses associated with the Winfrey Transaction, which includes $12.8
million of stock compensation related to the Winfrey Option. See “Non-GAAP Financial Measures” below for an explanation of our use
of non-GAAP financial measures.
In fiscal 2014, the decrease in operating income margin from fiscal 2013 was primarily the result of lower
gross margin partially offset by lower marketing expense. The decline was primarily driven by lower TV media
and production costs from first-time integrated, as well as the sharing among markets of, TV spots for both our
meetings and Online businesses, and lower and more efficient digital marketing spend in the United States.
In fiscal 2015, the decrease in operating income margin from fiscal 2014 was primarily the result of lower
gross margin and higher general and administrative expenses as a percentage of revenues, partially offset by
lower marketing expense. Excluding expenses associated with the Winfrey Transaction, general and
administrative expenses as a percentage of revenues were flat versus the prior year. The decline in marketing
expense from fiscal 2014 was primarily driven by lower TV media and production costs globally as well as lower
agency fees and celebrity and talent costs primarily in the United States.
Material Trends
Performance Indicators
Our management reviews and analyzes several key performance indicators in order to manage our business
and assess the quality and potential variability of our cash flows and earnings. These key performance indicators
include:
• Revenues—Our “Service Revenues” consist of “Meeting Fees” and “Online Subscription Revenues”.
“Meeting Fees” consist of the fees associated with our monthly commitment plans for unlimited access
to meetings and other payment arrangements for access to meetings, including our “pay-as-you-go”
payment arrangement and fees associated with our Total Access product. “Online Subscription
Revenues” consist of the fees associated with subscriptions for our Online subscription products,
including our Personal Coaching product.
• Paid Weeks—The “Paid Weeks” metric reports paid weeks by Weight Watchers customers in
Company-owned operations for a given period as follows: (i) “Meeting Paid Weeks” is the sum of total
paid commitment plan weeks (including Total Access) and total “pay-as-you-go” weeks; (ii) “Online
Paid Weeks” is the total paid subscription weeks for our digital subscription products (including
Personal Coaching); and (iii) “Total Paid Weeks” is the sum of Meeting Paid Weeks and Online Paid
Weeks, in each case for a given period.
38